Peruvian vs Immigrants from Lebanon Single Female Poverty
COMPARE
Peruvian
Immigrants from Lebanon
Single Female Poverty
Single Female Poverty Comparison
Peruvians
Immigrants from Lebanon
19.4%
SINGLE FEMALE POVERTY
99.4/ 100
METRIC RATING
76th/ 347
METRIC RANK
19.6%
SINGLE FEMALE POVERTY
98.8/ 100
METRIC RATING
90th/ 347
METRIC RANK
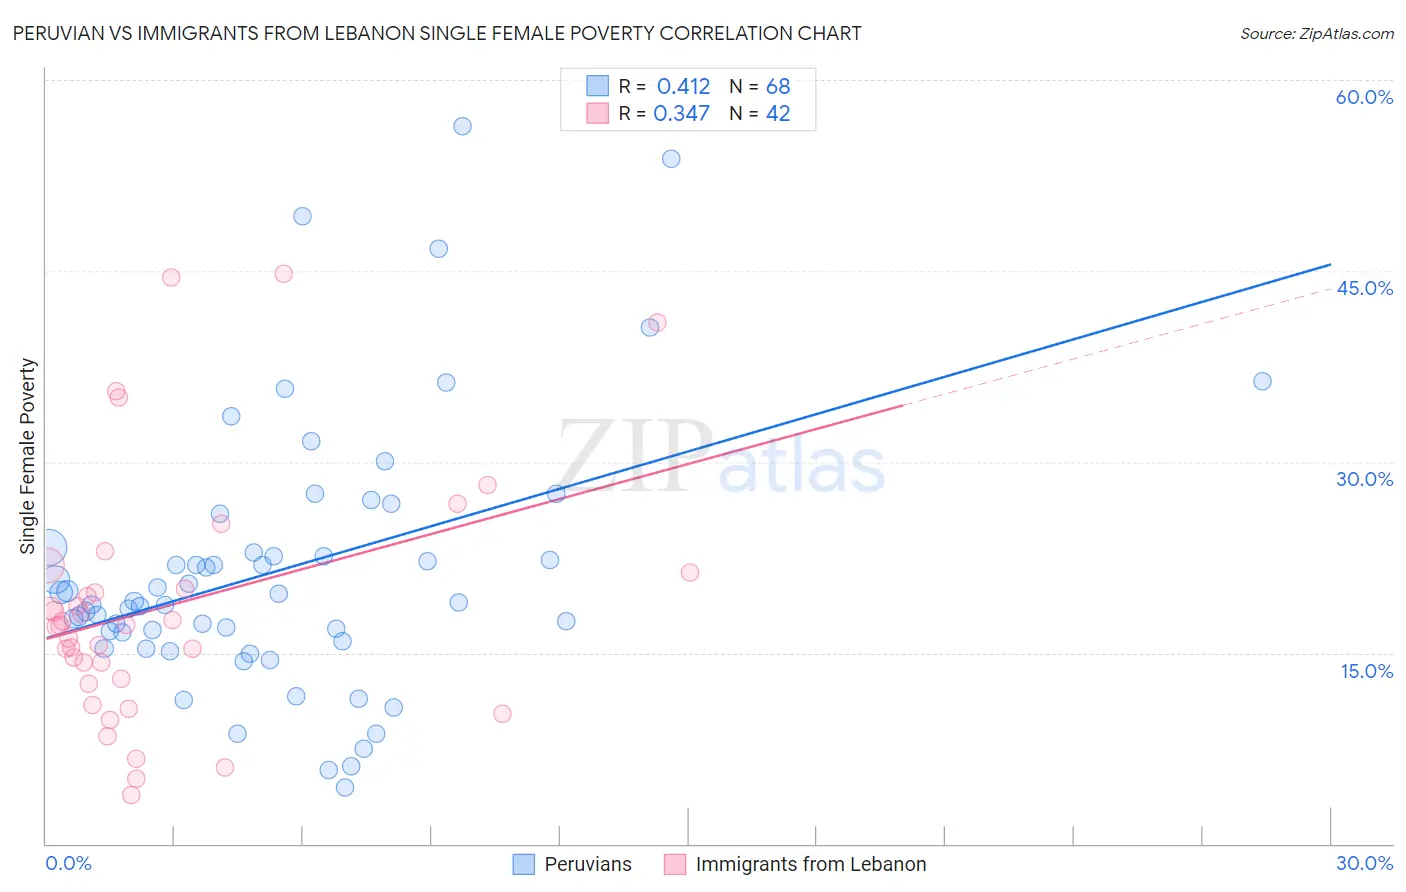
Peruvian vs Immigrants from Lebanon Single Female Poverty Correlation Chart
The statistical analysis conducted on geographies consisting of 358,317,102 people shows a moderate positive correlation between the proportion of Peruvians and poverty level among single females in the United States with a correlation coefficient (R) of 0.412 and weighted average of 19.4%. Similarly, the statistical analysis conducted on geographies consisting of 214,985,919 people shows a mild positive correlation between the proportion of Immigrants from Lebanon and poverty level among single females in the United States with a correlation coefficient (R) of 0.347 and weighted average of 19.6%, a difference of 1.0%.
Single Female Poverty Correlation Summary
| Measurement | Peruvian | Immigrants from Lebanon |
| Minimum | 4.4% | 3.8% |
| Maximum | 56.3% | 44.8% |
| Range | 51.9% | 41.0% |
| Mean | 21.5% | 18.7% |
| Median | 19.0% | 17.2% |
| Interquartile 25% (IQ1) | 16.2% | 13.0% |
| Interquartile 75% (IQ3) | 23.1% | 21.3% |
| Interquartile Range (IQR) | 6.8% | 8.3% |
| Standard Deviation (Sample) | 10.5% | 9.8% |
| Standard Deviation (Population) | 10.5% | 9.6% |
Demographics Similar to Peruvians and Immigrants from Lebanon by Single Female Poverty
In terms of single female poverty, the demographic groups most similar to Peruvians are Immigrants from Turkey (19.4%, a difference of 0.040%), Immigrants from Belarus (19.3%, a difference of 0.070%), Immigrants from Peru (19.3%, a difference of 0.090%), Immigrants from Russia (19.4%, a difference of 0.13%), and Albanian (19.4%, a difference of 0.20%). Similarly, the demographic groups most similar to Immigrants from Lebanon are Soviet Union (19.6%, a difference of 0.060%), Italian (19.6%, a difference of 0.11%), Immigrants from Austria (19.6%, a difference of 0.12%), Immigrants from Ukraine (19.5%, a difference of 0.17%), and Afghan (19.5%, a difference of 0.19%).
| Demographics | Rating | Rank | Single Female Poverty |
| Immigrants | Peru | 99.4 /100 | #73 | Exceptional 19.3% |
| Immigrants | Belarus | 99.4 /100 | #74 | Exceptional 19.3% |
| Immigrants | Turkey | 99.4 /100 | #75 | Exceptional 19.4% |
| Peruvians | 99.4 /100 | #76 | Exceptional 19.4% |
| Immigrants | Russia | 99.3 /100 | #77 | Exceptional 19.4% |
| Albanians | 99.3 /100 | #78 | Exceptional 19.4% |
| Immigrants | Sierra Leone | 99.3 /100 | #79 | Exceptional 19.4% |
| Immigrants | Australia | 99.3 /100 | #80 | Exceptional 19.4% |
| Immigrants | Scotland | 99.2 /100 | #81 | Exceptional 19.4% |
| Immigrants | Malaysia | 99.2 /100 | #82 | Exceptional 19.4% |
| Taiwanese | 99.2 /100 | #83 | Exceptional 19.4% |
| Immigrants | Sweden | 99.2 /100 | #84 | Exceptional 19.4% |
| Immigrants | Albania | 99.2 /100 | #85 | Exceptional 19.4% |
| Greeks | 99.2 /100 | #86 | Exceptional 19.4% |
| Zimbabweans | 99.0 /100 | #87 | Exceptional 19.5% |
| Afghans | 99.0 /100 | #88 | Exceptional 19.5% |
| Immigrants | Ukraine | 99.0 /100 | #89 | Exceptional 19.5% |
| Immigrants | Lebanon | 98.8 /100 | #90 | Exceptional 19.6% |
| Soviet Union | 98.8 /100 | #91 | Exceptional 19.6% |
| Italians | 98.8 /100 | #92 | Exceptional 19.6% |
| Immigrants | Austria | 98.8 /100 | #93 | Exceptional 19.6% |