Bulgarian vs Immigrants from Laos Family Poverty
COMPARE
Bulgarian
Immigrants from Laos
Family Poverty
Family Poverty Comparison
Bulgarians
Immigrants from Laos
7.1%
FAMILY POVERTY
99.8/ 100
METRIC RATING
10th/ 347
METRIC RANK
10.2%
FAMILY POVERTY
1.7/ 100
METRIC RATING
237th/ 347
METRIC RANK
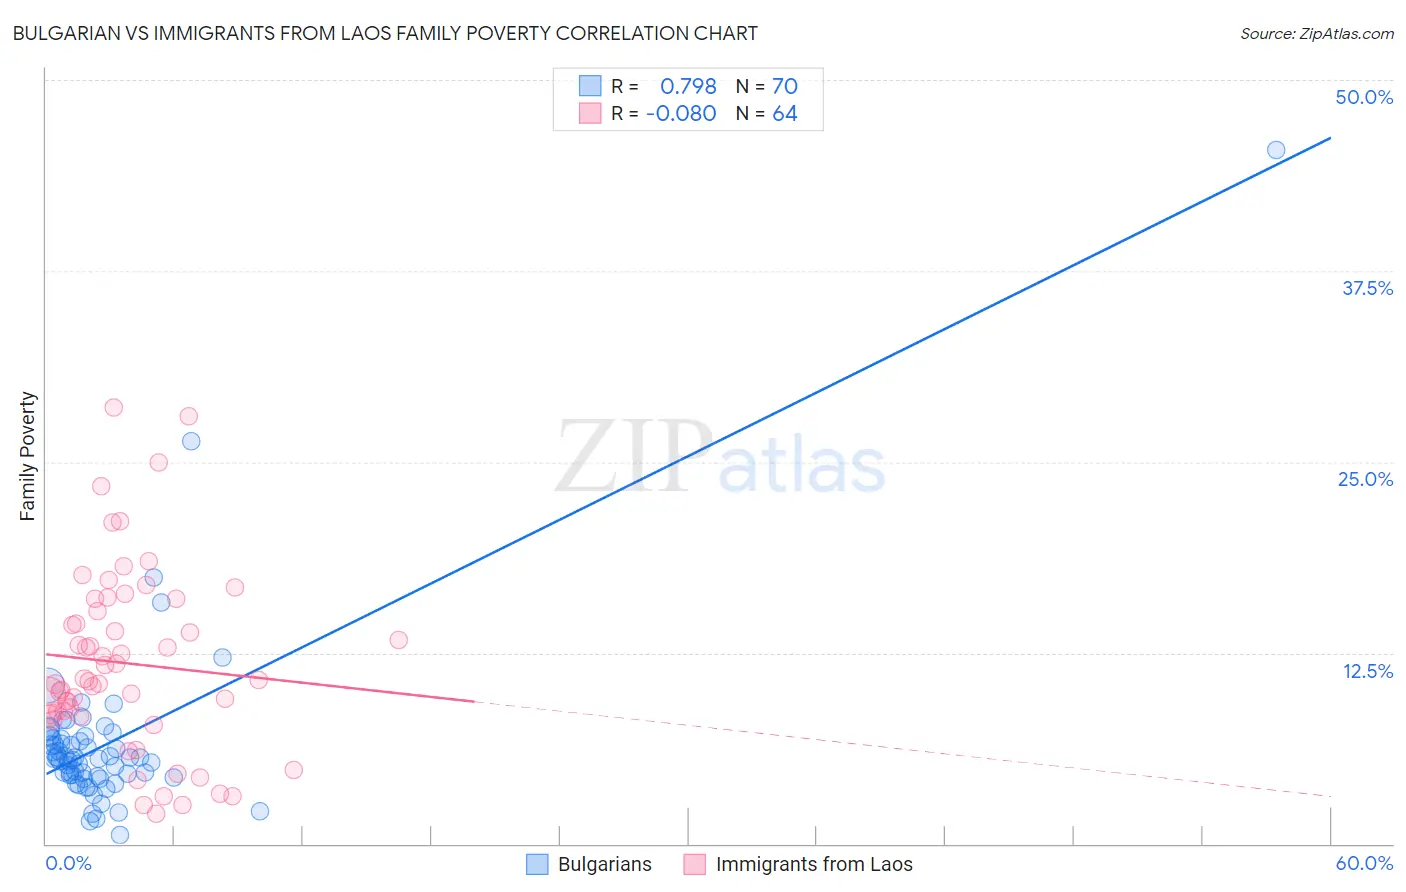
Bulgarian vs Immigrants from Laos Family Poverty Correlation Chart
The statistical analysis conducted on geographies consisting of 205,316,077 people shows a strong positive correlation between the proportion of Bulgarians and poverty level among families in the United States with a correlation coefficient (R) of 0.798 and weighted average of 7.1%. Similarly, the statistical analysis conducted on geographies consisting of 201,335,644 people shows a slight negative correlation between the proportion of Immigrants from Laos and poverty level among families in the United States with a correlation coefficient (R) of -0.080 and weighted average of 10.2%, a difference of 43.7%.
Family Poverty Correlation Summary
| Measurement | Bulgarian | Immigrants from Laos |
| Minimum | 0.55% | 2.0% |
| Maximum | 45.5% | 28.6% |
| Range | 44.9% | 26.6% |
| Mean | 6.7% | 11.8% |
| Median | 5.6% | 10.7% |
| Interquartile 25% (IQ1) | 4.4% | 8.4% |
| Interquartile 75% (IQ3) | 6.9% | 15.6% |
| Interquartile Range (IQR) | 2.5% | 7.2% |
| Standard Deviation (Sample) | 6.0% | 6.0% |
| Standard Deviation (Population) | 5.9% | 5.9% |
Similar Demographics by Family Poverty
Demographics Similar to Bulgarians by Family Poverty
In terms of family poverty, the demographic groups most similar to Bulgarians are Immigrants from Singapore (7.1%, a difference of 0.010%), Latvian (7.1%, a difference of 0.25%), Maltese (7.1%, a difference of 0.30%), Swedish (7.1%, a difference of 0.35%), and Iranian (7.1%, a difference of 0.36%).
| Demographics | Rating | Rank | Family Poverty |
| Immigrants | Taiwan | 100.0 /100 | #3 | Exceptional 6.6% |
| Filipinos | 100.0 /100 | #4 | Exceptional 6.6% |
| Thais | 100.0 /100 | #5 | Exceptional 6.7% |
| Norwegians | 99.9 /100 | #6 | Exceptional 6.9% |
| Immigrants | Ireland | 99.9 /100 | #7 | Exceptional 7.0% |
| Bhutanese | 99.9 /100 | #8 | Exceptional 7.0% |
| Latvians | 99.9 /100 | #9 | Exceptional 7.1% |
| Bulgarians | 99.8 /100 | #10 | Exceptional 7.1% |
| Immigrants | Singapore | 99.8 /100 | #11 | Exceptional 7.1% |
| Maltese | 99.8 /100 | #12 | Exceptional 7.1% |
| Swedes | 99.8 /100 | #13 | Exceptional 7.1% |
| Iranians | 99.8 /100 | #14 | Exceptional 7.1% |
| Lithuanians | 99.8 /100 | #15 | Exceptional 7.2% |
| Immigrants | South Central Asia | 99.8 /100 | #16 | Exceptional 7.2% |
| Luxembourgers | 99.8 /100 | #17 | Exceptional 7.2% |
Demographics Similar to Immigrants from Laos by Family Poverty
In terms of family poverty, the demographic groups most similar to Immigrants from Laos are Immigrants from Nigeria (10.2%, a difference of 0.26%), French American Indian (10.2%, a difference of 0.36%), Potawatomi (10.2%, a difference of 0.40%), Nigerian (10.1%, a difference of 0.51%), and Immigrants from Middle Africa (10.1%, a difference of 0.54%).
| Demographics | Rating | Rank | Family Poverty |
| Immigrants | Panama | 3.1 /100 | #230 | Tragic 10.0% |
| Alaskan Athabascans | 2.7 /100 | #231 | Tragic 10.1% |
| Immigrants | Sudan | 2.3 /100 | #232 | Tragic 10.1% |
| Fijians | 2.1 /100 | #233 | Tragic 10.1% |
| Immigrants | Middle Africa | 2.1 /100 | #234 | Tragic 10.1% |
| Nigerians | 2.0 /100 | #235 | Tragic 10.1% |
| Immigrants | Nigeria | 1.9 /100 | #236 | Tragic 10.2% |
| Immigrants | Laos | 1.7 /100 | #237 | Tragic 10.2% |
| French American Indians | 1.5 /100 | #238 | Tragic 10.2% |
| Potawatomi | 1.5 /100 | #239 | Tragic 10.2% |
| Immigrants | Azores | 1.4 /100 | #240 | Tragic 10.3% |
| Ghanaians | 1.3 /100 | #241 | Tragic 10.3% |
| Alaska Natives | 1.0 /100 | #242 | Tragic 10.4% |
| Nepalese | 0.8 /100 | #243 | Tragic 10.4% |
| Cree | 0.7 /100 | #244 | Tragic 10.5% |