Polish vs Immigrants from Laos Family Poverty
COMPARE
Polish
Immigrants from Laos
Family Poverty
Family Poverty Comparison
Poles
Immigrants from Laos
7.4%
FAMILY POVERTY
99.5/ 100
METRIC RATING
32nd/ 347
METRIC RANK
10.2%
FAMILY POVERTY
1.7/ 100
METRIC RATING
237th/ 347
METRIC RANK
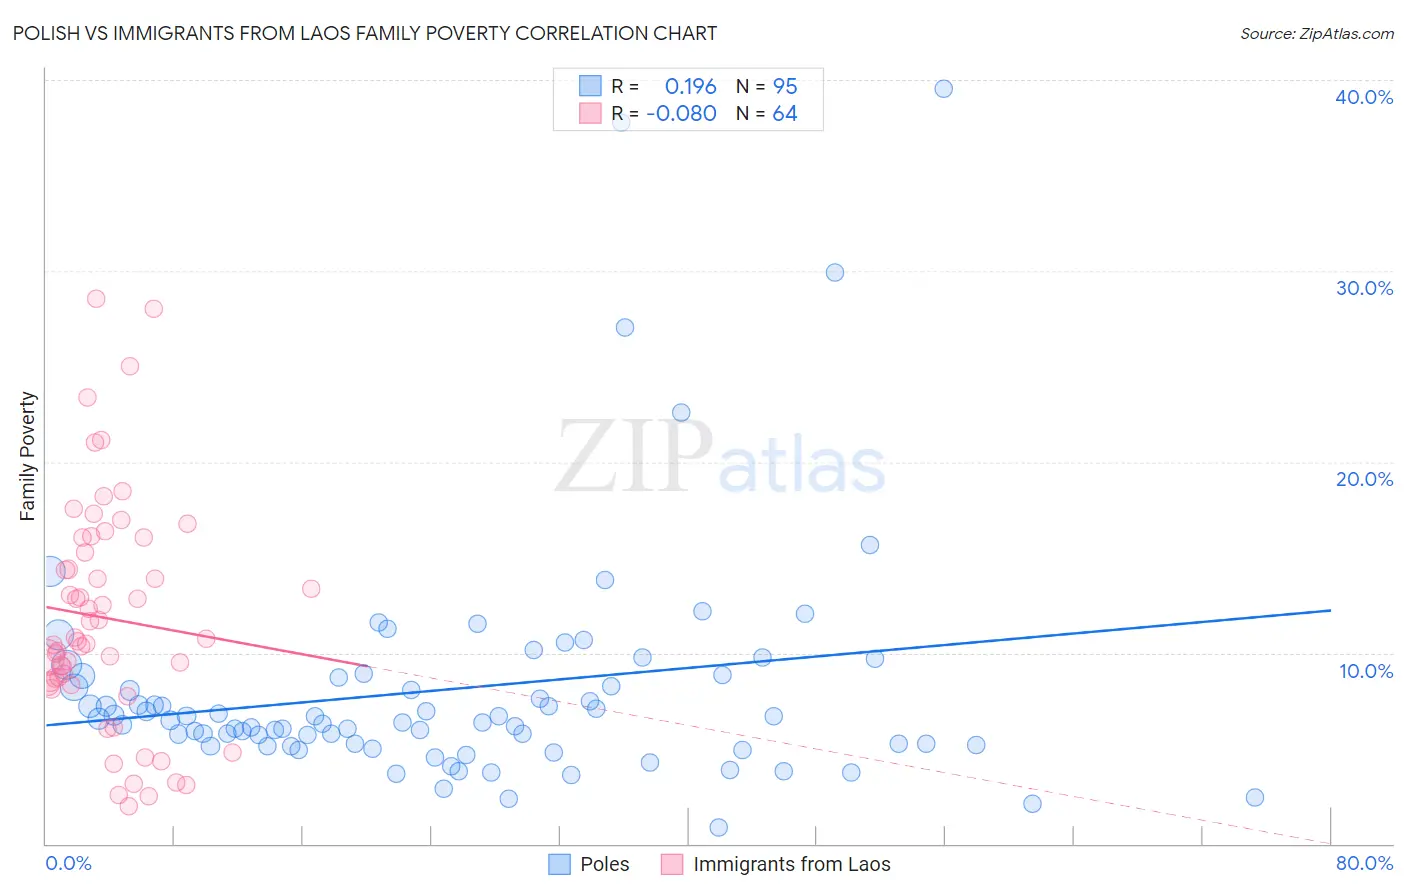
Polish vs Immigrants from Laos Family Poverty Correlation Chart
The statistical analysis conducted on geographies consisting of 555,842,099 people shows a poor positive correlation between the proportion of Poles and poverty level among families in the United States with a correlation coefficient (R) of 0.196 and weighted average of 7.4%. Similarly, the statistical analysis conducted on geographies consisting of 201,335,644 people shows a slight negative correlation between the proportion of Immigrants from Laos and poverty level among families in the United States with a correlation coefficient (R) of -0.080 and weighted average of 10.2%, a difference of 37.1%.
Family Poverty Correlation Summary
| Measurement | Polish | Immigrants from Laos |
| Minimum | 0.85% | 2.0% |
| Maximum | 39.6% | 28.6% |
| Range | 38.7% | 26.6% |
| Mean | 8.1% | 11.8% |
| Median | 6.5% | 10.7% |
| Interquartile 25% (IQ1) | 5.2% | 8.4% |
| Interquartile 75% (IQ3) | 8.8% | 15.6% |
| Interquartile Range (IQR) | 3.6% | 7.2% |
| Standard Deviation (Sample) | 6.3% | 6.0% |
| Standard Deviation (Population) | 6.3% | 5.9% |
Similar Demographics by Family Poverty
Demographics Similar to Poles by Family Poverty
In terms of family poverty, the demographic groups most similar to Poles are Immigrants from Japan (7.4%, a difference of 0.0%), Russian (7.5%, a difference of 0.23%), Czech (7.4%, a difference of 0.30%), Italian (7.4%, a difference of 0.42%), and Immigrants from Northern Europe (7.4%, a difference of 0.71%).
| Demographics | Rating | Rank | Family Poverty |
| Burmese | 99.7 /100 | #25 | Exceptional 7.3% |
| Cypriots | 99.6 /100 | #26 | Exceptional 7.3% |
| Immigrants | Scotland | 99.6 /100 | #27 | Exceptional 7.3% |
| Immigrants | Korea | 99.6 /100 | #28 | Exceptional 7.4% |
| Immigrants | Northern Europe | 99.6 /100 | #29 | Exceptional 7.4% |
| Italians | 99.6 /100 | #30 | Exceptional 7.4% |
| Czechs | 99.6 /100 | #31 | Exceptional 7.4% |
| Poles | 99.5 /100 | #32 | Exceptional 7.4% |
| Immigrants | Japan | 99.5 /100 | #33 | Exceptional 7.4% |
| Russians | 99.5 /100 | #34 | Exceptional 7.5% |
| Greeks | 99.4 /100 | #35 | Exceptional 7.5% |
| Turks | 99.4 /100 | #36 | Exceptional 7.5% |
| Estonians | 99.4 /100 | #37 | Exceptional 7.5% |
| Bolivians | 99.3 /100 | #38 | Exceptional 7.5% |
| Carpatho Rusyns | 99.3 /100 | #39 | Exceptional 7.5% |
Demographics Similar to Immigrants from Laos by Family Poverty
In terms of family poverty, the demographic groups most similar to Immigrants from Laos are Immigrants from Nigeria (10.2%, a difference of 0.26%), French American Indian (10.2%, a difference of 0.36%), Potawatomi (10.2%, a difference of 0.40%), Nigerian (10.1%, a difference of 0.51%), and Immigrants from Middle Africa (10.1%, a difference of 0.54%).
| Demographics | Rating | Rank | Family Poverty |
| Immigrants | Panama | 3.1 /100 | #230 | Tragic 10.0% |
| Alaskan Athabascans | 2.7 /100 | #231 | Tragic 10.1% |
| Immigrants | Sudan | 2.3 /100 | #232 | Tragic 10.1% |
| Fijians | 2.1 /100 | #233 | Tragic 10.1% |
| Immigrants | Middle Africa | 2.1 /100 | #234 | Tragic 10.1% |
| Nigerians | 2.0 /100 | #235 | Tragic 10.1% |
| Immigrants | Nigeria | 1.9 /100 | #236 | Tragic 10.2% |
| Immigrants | Laos | 1.7 /100 | #237 | Tragic 10.2% |
| French American Indians | 1.5 /100 | #238 | Tragic 10.2% |
| Potawatomi | 1.5 /100 | #239 | Tragic 10.2% |
| Immigrants | Azores | 1.4 /100 | #240 | Tragic 10.3% |
| Ghanaians | 1.3 /100 | #241 | Tragic 10.3% |
| Alaska Natives | 1.0 /100 | #242 | Tragic 10.4% |
| Nepalese | 0.8 /100 | #243 | Tragic 10.4% |
| Cree | 0.7 /100 | #244 | Tragic 10.5% |