Kiowa vs Choctaw Family Poverty
COMPARE
Kiowa
Choctaw
Family Poverty
Family Poverty Comparison
Kiowa
Choctaw
12.2%
FAMILY POVERTY
0.0/ 100
METRIC RATING
314th/ 347
METRIC RANK
11.6%
FAMILY POVERTY
0.0/ 100
METRIC RATING
296th/ 347
METRIC RANK
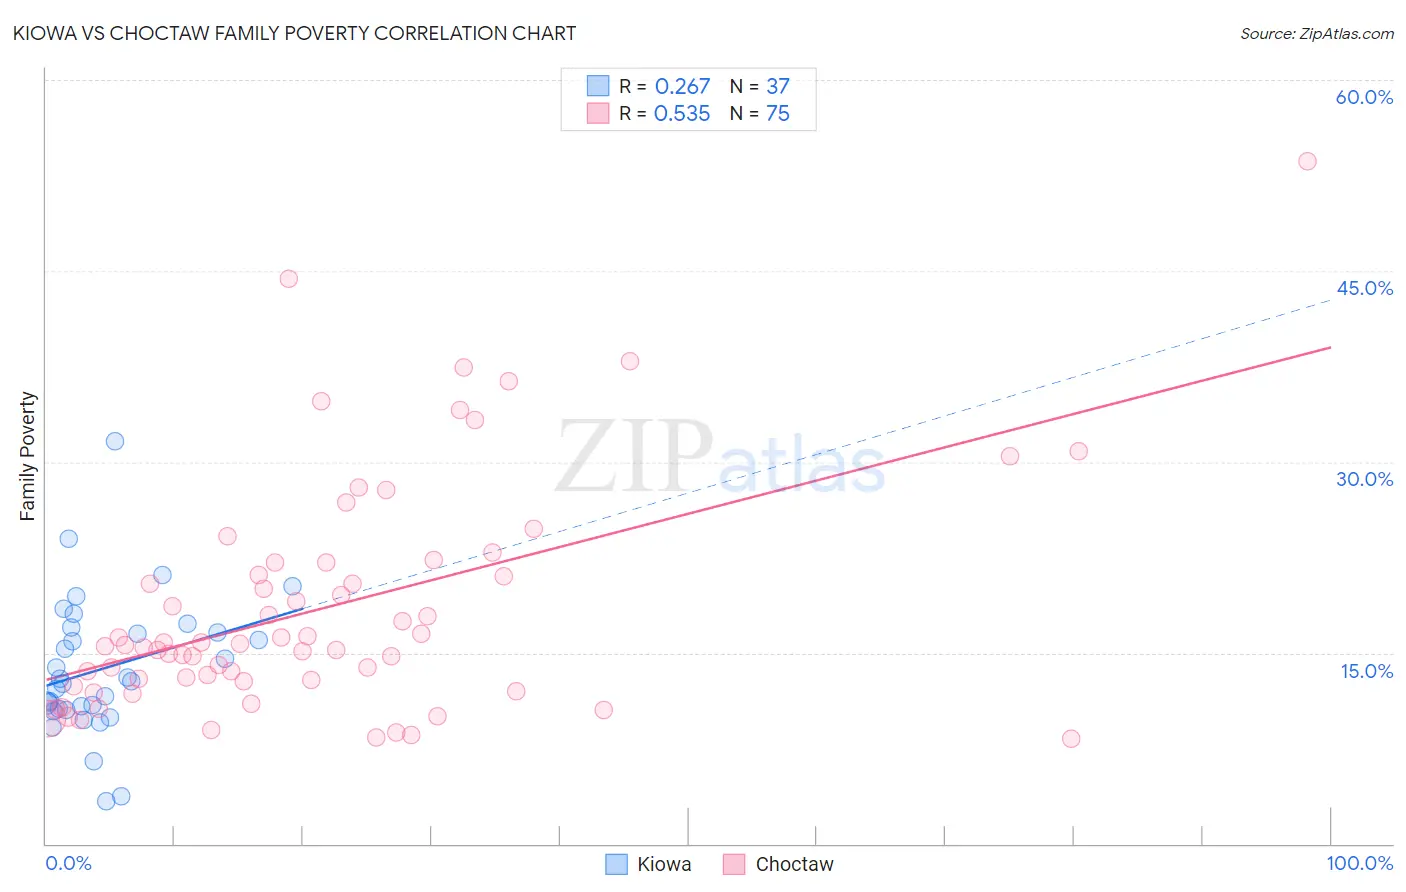
Kiowa vs Choctaw Family Poverty Correlation Chart
The statistical analysis conducted on geographies consisting of 56,081,442 people shows a weak positive correlation between the proportion of Kiowa and poverty level among families in the United States with a correlation coefficient (R) of 0.267 and weighted average of 12.2%. Similarly, the statistical analysis conducted on geographies consisting of 269,406,006 people shows a substantial positive correlation between the proportion of Choctaw and poverty level among families in the United States with a correlation coefficient (R) of 0.535 and weighted average of 11.6%, a difference of 5.3%.
Family Poverty Correlation Summary
| Measurement | Kiowa | Choctaw |
| Minimum | 3.4% | 8.2% |
| Maximum | 31.6% | 53.6% |
| Range | 28.3% | 45.4% |
| Mean | 13.8% | 18.5% |
| Median | 12.8% | 15.6% |
| Interquartile 25% (IQ1) | 10.6% | 12.7% |
| Interquartile 75% (IQ3) | 16.8% | 22.1% |
| Interquartile Range (IQR) | 6.2% | 9.3% |
| Standard Deviation (Sample) | 5.4% | 9.0% |
| Standard Deviation (Population) | 5.3% | 9.0% |
Demographics Similar to Kiowa and Choctaw by Family Poverty
In terms of family poverty, the demographic groups most similar to Kiowa are Immigrants from Mexico (12.3%, a difference of 0.26%), Immigrants from Caribbean (12.2%, a difference of 0.50%), Immigrants from Central America (12.1%, a difference of 1.2%), Ute (12.1%, a difference of 1.6%), and Immigrants from Guatemala (12.0%, a difference of 2.4%). Similarly, the demographic groups most similar to Choctaw are Immigrants from Haiti (11.6%, a difference of 0.050%), Creek (11.7%, a difference of 0.23%), Immigrants from Senegal (11.7%, a difference of 0.37%), Dutch West Indian (11.7%, a difference of 0.47%), and Immigrants from Bangladesh (11.7%, a difference of 0.48%).
| Demographics | Rating | Rank | Family Poverty |
| Immigrants | Haiti | 0.0 /100 | #295 | Tragic 11.6% |
| Choctaw | 0.0 /100 | #296 | Tragic 11.6% |
| Creek | 0.0 /100 | #297 | Tragic 11.7% |
| Immigrants | Senegal | 0.0 /100 | #298 | Tragic 11.7% |
| Dutch West Indians | 0.0 /100 | #299 | Tragic 11.7% |
| Immigrants | Bangladesh | 0.0 /100 | #300 | Tragic 11.7% |
| Bahamians | 0.0 /100 | #301 | Tragic 11.7% |
| Guatemalans | 0.0 /100 | #302 | Tragic 11.7% |
| Africans | 0.0 /100 | #303 | Tragic 11.8% |
| Immigrants | Latin America | 0.0 /100 | #304 | Tragic 11.8% |
| Mexicans | 0.0 /100 | #305 | Tragic 11.8% |
| Cajuns | 0.0 /100 | #306 | Tragic 11.9% |
| Immigrants | Congo | 0.0 /100 | #307 | Tragic 11.9% |
| Seminole | 0.0 /100 | #308 | Tragic 11.9% |
| Hispanics or Latinos | 0.0 /100 | #309 | Tragic 12.0% |
| Immigrants | Guatemala | 0.0 /100 | #310 | Tragic 12.0% |
| Ute | 0.0 /100 | #311 | Tragic 12.1% |
| Immigrants | Central America | 0.0 /100 | #312 | Tragic 12.1% |
| Immigrants | Caribbean | 0.0 /100 | #313 | Tragic 12.2% |
| Kiowa | 0.0 /100 | #314 | Tragic 12.2% |
| Immigrants | Mexico | 0.0 /100 | #315 | Tragic 12.3% |