Fijian vs Choctaw Family Poverty
COMPARE
Fijian
Choctaw
Family Poverty
Family Poverty Comparison
Fijians
Choctaw
10.1%
FAMILY POVERTY
2.1/ 100
METRIC RATING
233rd/ 347
METRIC RANK
11.6%
FAMILY POVERTY
0.0/ 100
METRIC RATING
296th/ 347
METRIC RANK
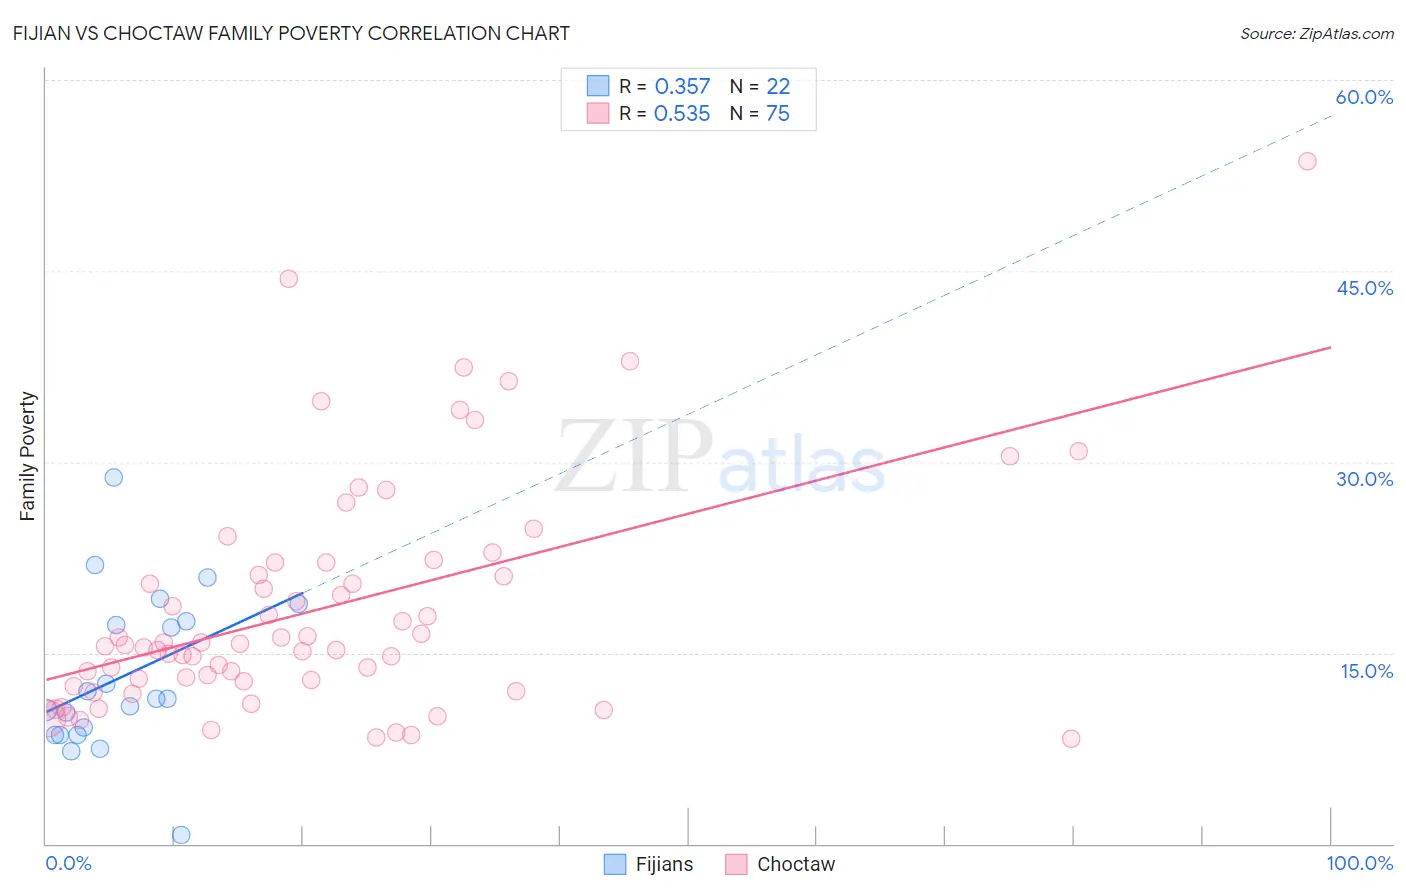
Fijian vs Choctaw Family Poverty Correlation Chart
The statistical analysis conducted on geographies consisting of 55,925,682 people shows a mild positive correlation between the proportion of Fijians and poverty level among families in the United States with a correlation coefficient (R) of 0.357 and weighted average of 10.1%. Similarly, the statistical analysis conducted on geographies consisting of 269,406,006 people shows a substantial positive correlation between the proportion of Choctaw and poverty level among families in the United States with a correlation coefficient (R) of 0.535 and weighted average of 11.6%, a difference of 14.7%.
Family Poverty Correlation Summary
| Measurement | Fijian | Choctaw |
| Minimum | 0.73% | 8.2% |
| Maximum | 28.8% | 53.6% |
| Range | 28.0% | 45.4% |
| Mean | 13.2% | 18.5% |
| Median | 11.4% | 15.6% |
| Interquartile 25% (IQ1) | 8.6% | 12.7% |
| Interquartile 75% (IQ3) | 17.5% | 22.1% |
| Interquartile Range (IQR) | 8.9% | 9.3% |
| Standard Deviation (Sample) | 6.3% | 9.0% |
| Standard Deviation (Population) | 6.1% | 9.0% |
Similar Demographics by Family Poverty
Demographics Similar to Fijians by Family Poverty
In terms of family poverty, the demographic groups most similar to Fijians are Immigrants from Middle Africa (10.1%, a difference of 0.11%), Nigerian (10.1%, a difference of 0.14%), Immigrants from Sudan (10.1%, a difference of 0.25%), Immigrants from Nigeria (10.2%, a difference of 0.39%), and Immigrants from Laos (10.2%, a difference of 0.65%).
| Demographics | Rating | Rank | Family Poverty |
| Ottawa | 3.3 /100 | #226 | Tragic 10.0% |
| Immigrants | Armenia | 3.3 /100 | #227 | Tragic 10.0% |
| Sudanese | 3.1 /100 | #228 | Tragic 10.0% |
| Immigrants | Uzbekistan | 3.1 /100 | #229 | Tragic 10.0% |
| Immigrants | Panama | 3.1 /100 | #230 | Tragic 10.0% |
| Alaskan Athabascans | 2.7 /100 | #231 | Tragic 10.1% |
| Immigrants | Sudan | 2.3 /100 | #232 | Tragic 10.1% |
| Fijians | 2.1 /100 | #233 | Tragic 10.1% |
| Immigrants | Middle Africa | 2.1 /100 | #234 | Tragic 10.1% |
| Nigerians | 2.0 /100 | #235 | Tragic 10.1% |
| Immigrants | Nigeria | 1.9 /100 | #236 | Tragic 10.2% |
| Immigrants | Laos | 1.7 /100 | #237 | Tragic 10.2% |
| French American Indians | 1.5 /100 | #238 | Tragic 10.2% |
| Potawatomi | 1.5 /100 | #239 | Tragic 10.2% |
| Immigrants | Azores | 1.4 /100 | #240 | Tragic 10.3% |
Demographics Similar to Choctaw by Family Poverty
In terms of family poverty, the demographic groups most similar to Choctaw are Immigrants from Haiti (11.6%, a difference of 0.050%), Immigrants from St. Vincent and the Grenadines (11.6%, a difference of 0.17%), Creek (11.7%, a difference of 0.23%), Immigrants from Cabo Verde (11.6%, a difference of 0.25%), and Immigrants from Senegal (11.7%, a difference of 0.37%).
| Demographics | Rating | Rank | Family Poverty |
| Immigrants | Barbados | 0.0 /100 | #289 | Tragic 11.5% |
| West Indians | 0.0 /100 | #290 | Tragic 11.5% |
| Haitians | 0.0 /100 | #291 | Tragic 11.5% |
| Immigrants | Somalia | 0.0 /100 | #292 | Tragic 11.5% |
| Immigrants | Cabo Verde | 0.0 /100 | #293 | Tragic 11.6% |
| Immigrants | St. Vincent and the Grenadines | 0.0 /100 | #294 | Tragic 11.6% |
| Immigrants | Haiti | 0.0 /100 | #295 | Tragic 11.6% |
| Choctaw | 0.0 /100 | #296 | Tragic 11.6% |
| Creek | 0.0 /100 | #297 | Tragic 11.7% |
| Immigrants | Senegal | 0.0 /100 | #298 | Tragic 11.7% |
| Dutch West Indians | 0.0 /100 | #299 | Tragic 11.7% |
| Immigrants | Bangladesh | 0.0 /100 | #300 | Tragic 11.7% |
| Bahamians | 0.0 /100 | #301 | Tragic 11.7% |
| Guatemalans | 0.0 /100 | #302 | Tragic 11.7% |
| Africans | 0.0 /100 | #303 | Tragic 11.8% |