Paraguayan vs Venezuelan Receiving Food Stamps
COMPARE
Paraguayan
Venezuelan
Receiving Food Stamps
Receiving Food Stamps Comparison
Paraguayans
Venezuelans
10.7%
RECEIVING FOOD STAMPS
93.0/ 100
METRIC RATING
124th/ 347
METRIC RANK
12.0%
RECEIVING FOOD STAMPS
32.1/ 100
METRIC RATING
191st/ 347
METRIC RANK
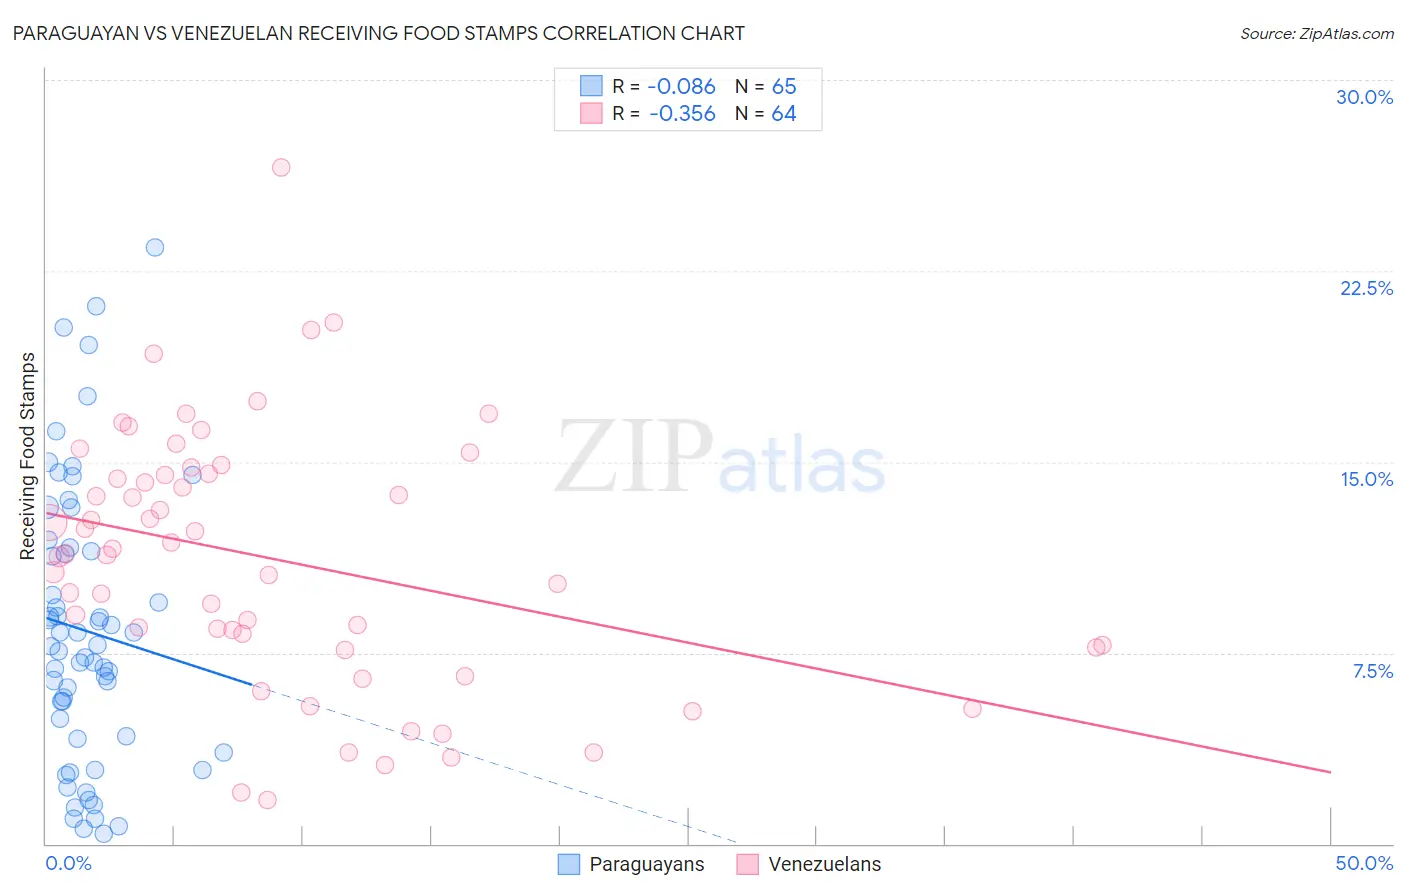
Paraguayan vs Venezuelan Receiving Food Stamps Correlation Chart
The statistical analysis conducted on geographies consisting of 95,051,783 people shows a slight negative correlation between the proportion of Paraguayans and percentage of population receiving government assistance and/or food stamps in the United States with a correlation coefficient (R) of -0.086 and weighted average of 10.7%. Similarly, the statistical analysis conducted on geographies consisting of 305,571,015 people shows a mild negative correlation between the proportion of Venezuelans and percentage of population receiving government assistance and/or food stamps in the United States with a correlation coefficient (R) of -0.356 and weighted average of 12.0%, a difference of 12.8%.
Receiving Food Stamps Correlation Summary
| Measurement | Paraguayan | Venezuelan |
| Minimum | 0.40% | 1.7% |
| Maximum | 23.4% | 26.6% |
| Range | 23.0% | 24.9% |
| Mean | 8.4% | 11.1% |
| Median | 7.8% | 11.4% |
| Interquartile 25% (IQ1) | 4.2% | 7.7% |
| Interquartile 75% (IQ3) | 11.6% | 14.5% |
| Interquartile Range (IQR) | 7.4% | 6.8% |
| Standard Deviation (Sample) | 5.4% | 5.0% |
| Standard Deviation (Population) | 5.4% | 5.0% |
Similar Demographics by Receiving Food Stamps
Demographics Similar to Paraguayans by Receiving Food Stamps
In terms of receiving food stamps, the demographic groups most similar to Paraguayans are Ukrainian (10.7%, a difference of 0.080%), Immigrants from Philippines (10.7%, a difference of 0.21%), Afghan (10.7%, a difference of 0.22%), Immigrants from Ethiopia (10.7%, a difference of 0.25%), and Immigrants from Jordan (10.7%, a difference of 0.26%).
| Demographics | Rating | Rank | Receiving Food Stamps |
| Immigrants | Nepal | 94.6 /100 | #117 | Exceptional 10.6% |
| Assyrians/Chaldeans/Syriacs | 94.1 /100 | #118 | Exceptional 10.6% |
| Immigrants | Poland | 93.9 /100 | #119 | Exceptional 10.6% |
| Ethiopians | 93.9 /100 | #120 | Exceptional 10.6% |
| Slavs | 93.8 /100 | #121 | Exceptional 10.6% |
| Sri Lankans | 93.7 /100 | #122 | Exceptional 10.6% |
| Immigrants | Philippines | 93.3 /100 | #123 | Exceptional 10.7% |
| Paraguayans | 93.0 /100 | #124 | Exceptional 10.7% |
| Ukrainians | 92.8 /100 | #125 | Exceptional 10.7% |
| Afghans | 92.6 /100 | #126 | Exceptional 10.7% |
| Immigrants | Ethiopia | 92.6 /100 | #127 | Exceptional 10.7% |
| Immigrants | Jordan | 92.5 /100 | #128 | Exceptional 10.7% |
| Yugoslavians | 92.5 /100 | #129 | Exceptional 10.7% |
| Israelis | 92.4 /100 | #130 | Exceptional 10.7% |
| French | 92.3 /100 | #131 | Exceptional 10.7% |
Demographics Similar to Venezuelans by Receiving Food Stamps
In terms of receiving food stamps, the demographic groups most similar to Venezuelans are Immigrants from Peru (12.0%, a difference of 0.010%), Immigrants from Cameroon (12.0%, a difference of 0.060%), Samoan (12.1%, a difference of 0.18%), Sudanese (12.0%, a difference of 0.20%), and Albanian (12.0%, a difference of 0.51%).
| Demographics | Rating | Rank | Receiving Food Stamps |
| Spaniards | 39.8 /100 | #184 | Fair 11.9% |
| Immigrants | Iraq | 37.1 /100 | #185 | Fair 12.0% |
| Spanish | 36.9 /100 | #186 | Fair 12.0% |
| Albanians | 35.4 /100 | #187 | Fair 12.0% |
| Sudanese | 33.4 /100 | #188 | Fair 12.0% |
| Immigrants | Cameroon | 32.5 /100 | #189 | Fair 12.0% |
| Immigrants | Peru | 32.2 /100 | #190 | Fair 12.0% |
| Venezuelans | 32.1 /100 | #191 | Fair 12.0% |
| Samoans | 31.0 /100 | #192 | Fair 12.1% |
| Immigrants | Fiji | 27.8 /100 | #193 | Fair 12.1% |
| Immigrants | Sudan | 27.1 /100 | #194 | Fair 12.1% |
| Americans | 26.7 /100 | #195 | Fair 12.2% |
| Iraqis | 26.6 /100 | #196 | Fair 12.2% |
| Delaware | 26.1 /100 | #197 | Fair 12.2% |
| Immigrants | Costa Rica | 25.4 /100 | #198 | Fair 12.2% |