Immigrants from Korea vs Venezuelan Receiving Food Stamps
COMPARE
Immigrants from Korea
Venezuelan
Receiving Food Stamps
Receiving Food Stamps Comparison
Immigrants from Korea
Venezuelans
8.7%
RECEIVING FOOD STAMPS
99.9/ 100
METRIC RATING
9th/ 347
METRIC RANK
12.0%
RECEIVING FOOD STAMPS
32.1/ 100
METRIC RATING
191st/ 347
METRIC RANK
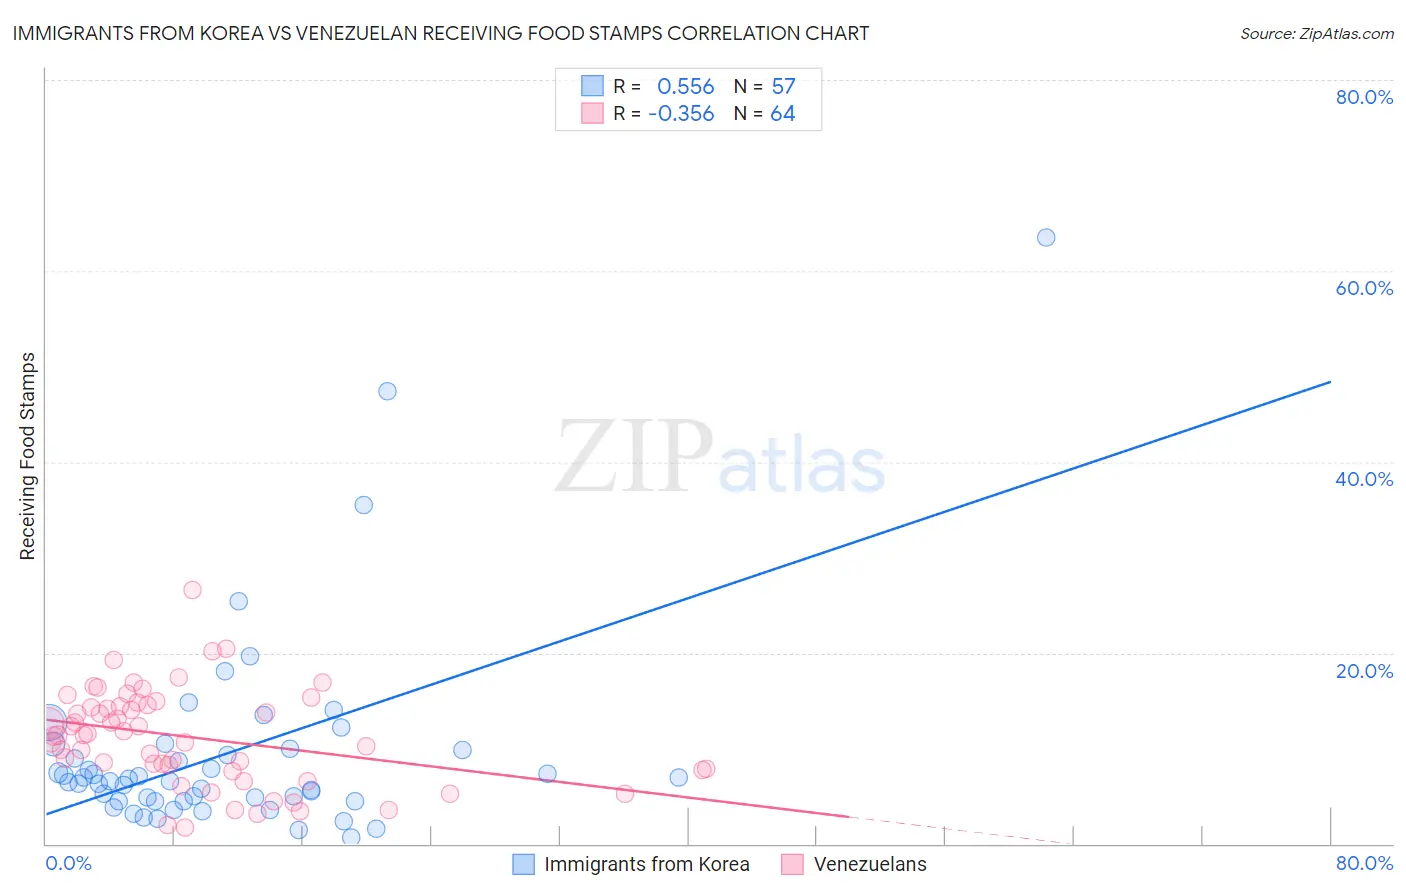
Immigrants from Korea vs Venezuelan Receiving Food Stamps Correlation Chart
The statistical analysis conducted on geographies consisting of 414,765,155 people shows a substantial positive correlation between the proportion of Immigrants from Korea and percentage of population receiving government assistance and/or food stamps in the United States with a correlation coefficient (R) of 0.556 and weighted average of 8.7%. Similarly, the statistical analysis conducted on geographies consisting of 305,571,015 people shows a mild negative correlation between the proportion of Venezuelans and percentage of population receiving government assistance and/or food stamps in the United States with a correlation coefficient (R) of -0.356 and weighted average of 12.0%, a difference of 39.0%.
Receiving Food Stamps Correlation Summary
| Measurement | Immigrants from Korea | Venezuelan |
| Minimum | 0.70% | 1.7% |
| Maximum | 63.5% | 26.6% |
| Range | 62.8% | 24.9% |
| Mean | 9.5% | 11.1% |
| Median | 6.6% | 11.4% |
| Interquartile 25% (IQ1) | 4.5% | 7.7% |
| Interquartile 75% (IQ3) | 9.9% | 14.5% |
| Interquartile Range (IQR) | 5.4% | 6.8% |
| Standard Deviation (Sample) | 10.7% | 5.0% |
| Standard Deviation (Population) | 10.6% | 5.0% |
Similar Demographics by Receiving Food Stamps
Demographics Similar to Immigrants from Korea by Receiving Food Stamps
In terms of receiving food stamps, the demographic groups most similar to Immigrants from Korea are Burmese (8.6%, a difference of 0.16%), Immigrants from South Central Asia (8.8%, a difference of 1.9%), Okinawan (8.9%, a difference of 2.4%), Cypriot (8.9%, a difference of 2.4%), and Bulgarian (8.9%, a difference of 2.6%).
| Demographics | Rating | Rank | Receiving Food Stamps |
| Immigrants | India | 100.0 /100 | #2 | Exceptional 7.4% |
| Filipinos | 100.0 /100 | #3 | Exceptional 7.4% |
| Iranians | 100.0 /100 | #4 | Exceptional 7.9% |
| Thais | 100.0 /100 | #5 | Exceptional 8.1% |
| Immigrants | Singapore | 100.0 /100 | #6 | Exceptional 8.3% |
| Immigrants | Iran | 100.0 /100 | #7 | Exceptional 8.3% |
| Burmese | 99.9 /100 | #8 | Exceptional 8.6% |
| Immigrants | Korea | 99.9 /100 | #9 | Exceptional 8.7% |
| Immigrants | South Central Asia | 99.9 /100 | #10 | Exceptional 8.8% |
| Okinawans | 99.9 /100 | #11 | Exceptional 8.9% |
| Cypriots | 99.9 /100 | #12 | Exceptional 8.9% |
| Bulgarians | 99.9 /100 | #13 | Exceptional 8.9% |
| Maltese | 99.9 /100 | #14 | Exceptional 8.9% |
| Norwegians | 99.9 /100 | #15 | Exceptional 9.0% |
| Immigrants | Japan | 99.9 /100 | #16 | Exceptional 9.0% |
Demographics Similar to Venezuelans by Receiving Food Stamps
In terms of receiving food stamps, the demographic groups most similar to Venezuelans are Immigrants from Peru (12.0%, a difference of 0.010%), Immigrants from Cameroon (12.0%, a difference of 0.060%), Samoan (12.1%, a difference of 0.18%), Sudanese (12.0%, a difference of 0.20%), and Albanian (12.0%, a difference of 0.51%).
| Demographics | Rating | Rank | Receiving Food Stamps |
| Spaniards | 39.8 /100 | #184 | Fair 11.9% |
| Immigrants | Iraq | 37.1 /100 | #185 | Fair 12.0% |
| Spanish | 36.9 /100 | #186 | Fair 12.0% |
| Albanians | 35.4 /100 | #187 | Fair 12.0% |
| Sudanese | 33.4 /100 | #188 | Fair 12.0% |
| Immigrants | Cameroon | 32.5 /100 | #189 | Fair 12.0% |
| Immigrants | Peru | 32.2 /100 | #190 | Fair 12.0% |
| Venezuelans | 32.1 /100 | #191 | Fair 12.0% |
| Samoans | 31.0 /100 | #192 | Fair 12.1% |
| Immigrants | Fiji | 27.8 /100 | #193 | Fair 12.1% |
| Immigrants | Sudan | 27.1 /100 | #194 | Fair 12.1% |
| Americans | 26.7 /100 | #195 | Fair 12.2% |
| Iraqis | 26.6 /100 | #196 | Fair 12.2% |
| Delaware | 26.1 /100 | #197 | Fair 12.2% |
| Immigrants | Costa Rica | 25.4 /100 | #198 | Fair 12.2% |