Ethiopian vs Venezuelan Receiving Food Stamps
COMPARE
Ethiopian
Venezuelan
Receiving Food Stamps
Receiving Food Stamps Comparison
Ethiopians
Venezuelans
10.6%
RECEIVING FOOD STAMPS
93.9/ 100
METRIC RATING
120th/ 347
METRIC RANK
12.0%
RECEIVING FOOD STAMPS
32.1/ 100
METRIC RATING
191st/ 347
METRIC RANK
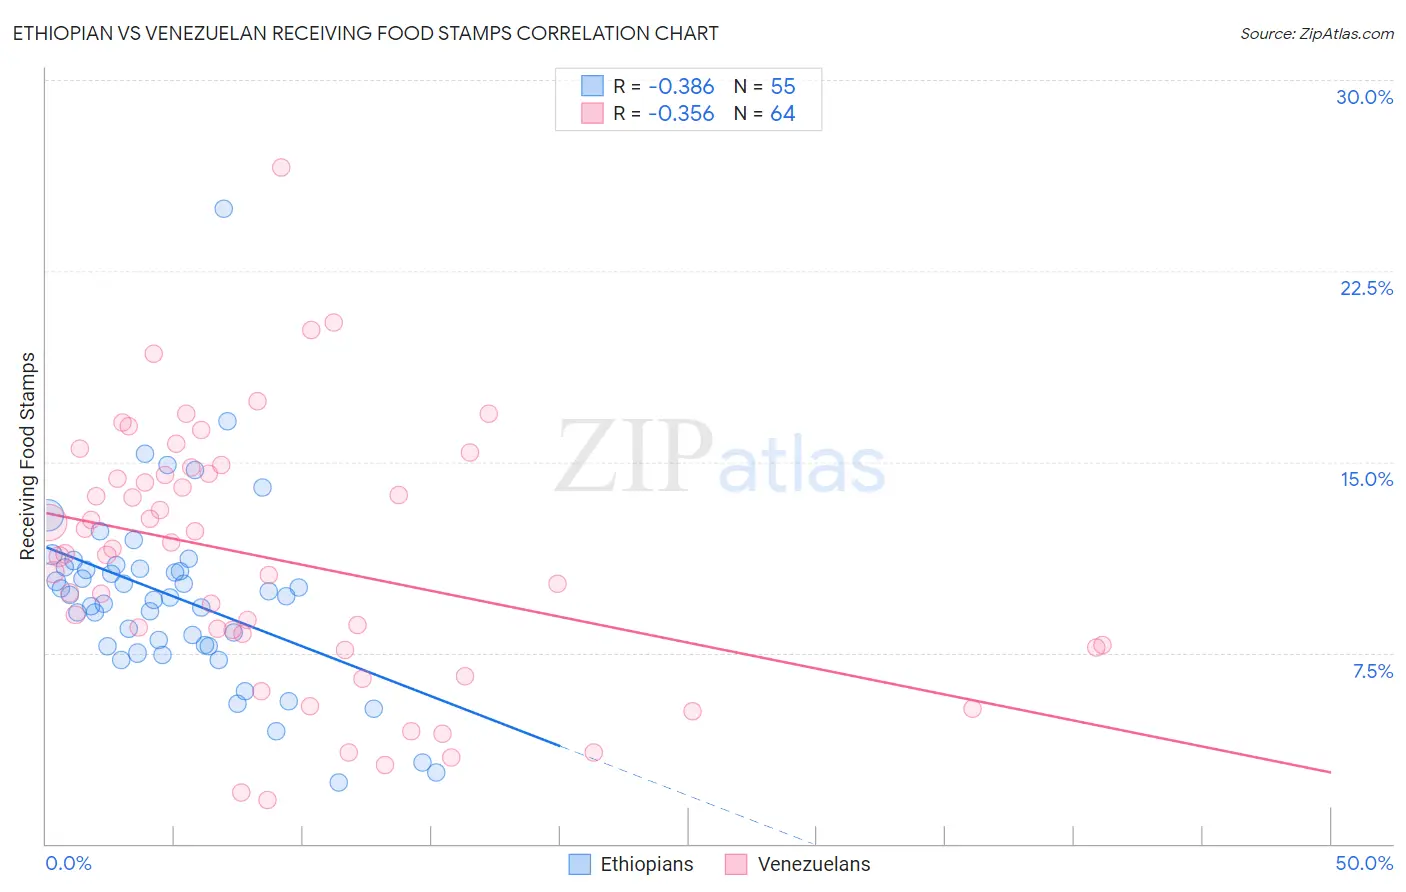
Ethiopian vs Venezuelan Receiving Food Stamps Correlation Chart
The statistical analysis conducted on geographies consisting of 222,869,008 people shows a mild negative correlation between the proportion of Ethiopians and percentage of population receiving government assistance and/or food stamps in the United States with a correlation coefficient (R) of -0.386 and weighted average of 10.6%. Similarly, the statistical analysis conducted on geographies consisting of 305,571,015 people shows a mild negative correlation between the proportion of Venezuelans and percentage of population receiving government assistance and/or food stamps in the United States with a correlation coefficient (R) of -0.356 and weighted average of 12.0%, a difference of 13.5%.
Receiving Food Stamps Correlation Summary
| Measurement | Ethiopian | Venezuelan |
| Minimum | 2.4% | 1.7% |
| Maximum | 24.9% | 26.6% |
| Range | 22.5% | 24.9% |
| Mean | 9.7% | 11.1% |
| Median | 9.7% | 11.4% |
| Interquartile 25% (IQ1) | 7.8% | 7.7% |
| Interquartile 75% (IQ3) | 10.9% | 14.5% |
| Interquartile Range (IQR) | 3.1% | 6.8% |
| Standard Deviation (Sample) | 3.6% | 5.0% |
| Standard Deviation (Population) | 3.6% | 5.0% |
Similar Demographics by Receiving Food Stamps
Demographics Similar to Ethiopians by Receiving Food Stamps
In terms of receiving food stamps, the demographic groups most similar to Ethiopians are Immigrants from Poland (10.6%, a difference of 0.0%), Slavic (10.6%, a difference of 0.030%), Sri Lankan (10.6%, a difference of 0.11%), Assyrian/Chaldean/Syriac (10.6%, a difference of 0.17%), and Immigrants from Philippines (10.7%, a difference of 0.36%).
| Demographics | Rating | Rank | Receiving Food Stamps |
| Icelanders | 95.4 /100 | #113 | Exceptional 10.5% |
| Scotch-Irish | 95.1 /100 | #114 | Exceptional 10.5% |
| Immigrants | Saudi Arabia | 94.9 /100 | #115 | Exceptional 10.5% |
| Canadians | 94.8 /100 | #116 | Exceptional 10.5% |
| Immigrants | Nepal | 94.6 /100 | #117 | Exceptional 10.6% |
| Assyrians/Chaldeans/Syriacs | 94.1 /100 | #118 | Exceptional 10.6% |
| Immigrants | Poland | 93.9 /100 | #119 | Exceptional 10.6% |
| Ethiopians | 93.9 /100 | #120 | Exceptional 10.6% |
| Slavs | 93.8 /100 | #121 | Exceptional 10.6% |
| Sri Lankans | 93.7 /100 | #122 | Exceptional 10.6% |
| Immigrants | Philippines | 93.3 /100 | #123 | Exceptional 10.7% |
| Paraguayans | 93.0 /100 | #124 | Exceptional 10.7% |
| Ukrainians | 92.8 /100 | #125 | Exceptional 10.7% |
| Afghans | 92.6 /100 | #126 | Exceptional 10.7% |
| Immigrants | Ethiopia | 92.6 /100 | #127 | Exceptional 10.7% |
Demographics Similar to Venezuelans by Receiving Food Stamps
In terms of receiving food stamps, the demographic groups most similar to Venezuelans are Immigrants from Peru (12.0%, a difference of 0.010%), Immigrants from Cameroon (12.0%, a difference of 0.060%), Samoan (12.1%, a difference of 0.18%), Sudanese (12.0%, a difference of 0.20%), and Albanian (12.0%, a difference of 0.51%).
| Demographics | Rating | Rank | Receiving Food Stamps |
| Spaniards | 39.8 /100 | #184 | Fair 11.9% |
| Immigrants | Iraq | 37.1 /100 | #185 | Fair 12.0% |
| Spanish | 36.9 /100 | #186 | Fair 12.0% |
| Albanians | 35.4 /100 | #187 | Fair 12.0% |
| Sudanese | 33.4 /100 | #188 | Fair 12.0% |
| Immigrants | Cameroon | 32.5 /100 | #189 | Fair 12.0% |
| Immigrants | Peru | 32.2 /100 | #190 | Fair 12.0% |
| Venezuelans | 32.1 /100 | #191 | Fair 12.0% |
| Samoans | 31.0 /100 | #192 | Fair 12.1% |
| Immigrants | Fiji | 27.8 /100 | #193 | Fair 12.1% |
| Immigrants | Sudan | 27.1 /100 | #194 | Fair 12.1% |
| Americans | 26.7 /100 | #195 | Fair 12.2% |
| Iraqis | 26.6 /100 | #196 | Fair 12.2% |
| Delaware | 26.1 /100 | #197 | Fair 12.2% |
| Immigrants | Costa Rica | 25.4 /100 | #198 | Fair 12.2% |