Colombian vs Venezuelan Receiving Food Stamps
COMPARE
Colombian
Venezuelan
Receiving Food Stamps
Receiving Food Stamps Comparison
Colombians
Venezuelans
12.6%
RECEIVING FOOD STAMPS
10.2/ 100
METRIC RATING
211th/ 347
METRIC RANK
12.0%
RECEIVING FOOD STAMPS
32.1/ 100
METRIC RATING
191st/ 347
METRIC RANK
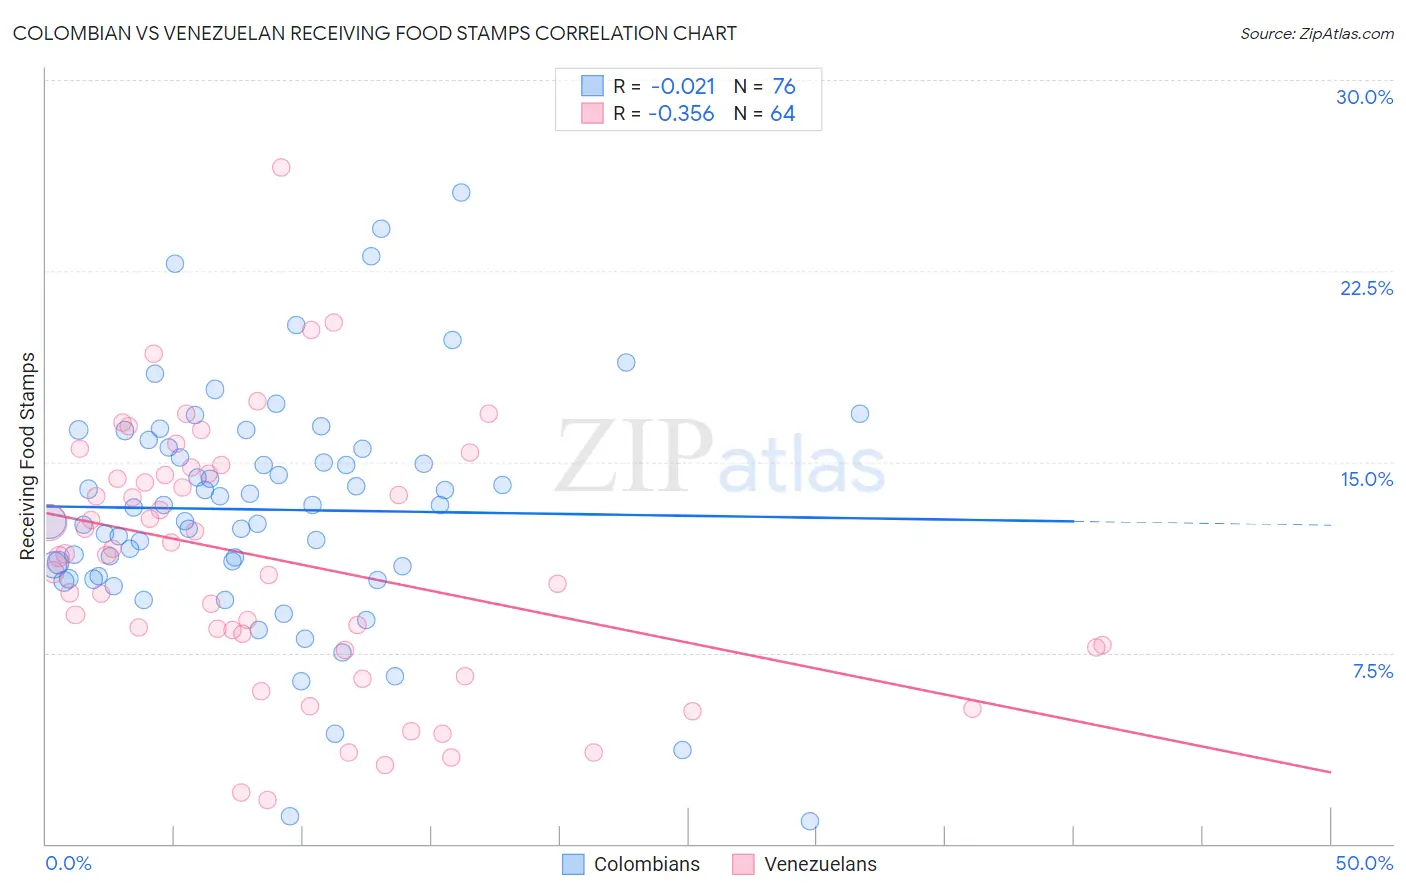
Colombian vs Venezuelan Receiving Food Stamps Correlation Chart
The statistical analysis conducted on geographies consisting of 418,206,966 people shows no correlation between the proportion of Colombians and percentage of population receiving government assistance and/or food stamps in the United States with a correlation coefficient (R) of -0.021 and weighted average of 12.6%. Similarly, the statistical analysis conducted on geographies consisting of 305,571,015 people shows a mild negative correlation between the proportion of Venezuelans and percentage of population receiving government assistance and/or food stamps in the United States with a correlation coefficient (R) of -0.356 and weighted average of 12.0%, a difference of 4.9%.
Receiving Food Stamps Correlation Summary
| Measurement | Colombian | Venezuelan |
| Minimum | 0.90% | 1.7% |
| Maximum | 25.6% | 26.6% |
| Range | 24.7% | 24.9% |
| Mean | 13.1% | 11.1% |
| Median | 13.3% | 11.4% |
| Interquartile 25% (IQ1) | 10.7% | 7.7% |
| Interquartile 75% (IQ3) | 15.5% | 14.5% |
| Interquartile Range (IQR) | 4.8% | 6.8% |
| Standard Deviation (Sample) | 4.6% | 5.0% |
| Standard Deviation (Population) | 4.5% | 5.0% |
Demographics Similar to Colombians and Venezuelans by Receiving Food Stamps
In terms of receiving food stamps, the demographic groups most similar to Colombians are Immigrants from Uruguay (12.5%, a difference of 0.83%), Immigrants from Sierra Leone (12.5%, a difference of 0.86%), Potawatomi (12.5%, a difference of 1.3%), South American (12.4%, a difference of 1.7%), and Immigrants from Thailand (12.4%, a difference of 2.0%). Similarly, the demographic groups most similar to Venezuelans are Samoan (12.1%, a difference of 0.18%), Immigrants from Fiji (12.1%, a difference of 0.71%), Immigrants from Sudan (12.1%, a difference of 0.82%), American (12.2%, a difference of 0.88%), and Iraqi (12.2%, a difference of 0.91%).
| Demographics | Rating | Rank | Receiving Food Stamps |
| Venezuelans | 32.1 /100 | #191 | Fair 12.0% |
| Samoans | 31.0 /100 | #192 | Fair 12.1% |
| Immigrants | Fiji | 27.8 /100 | #193 | Fair 12.1% |
| Immigrants | Sudan | 27.1 /100 | #194 | Fair 12.1% |
| Americans | 26.7 /100 | #195 | Fair 12.2% |
| Iraqis | 26.6 /100 | #196 | Fair 12.2% |
| Delaware | 26.1 /100 | #197 | Fair 12.2% |
| Immigrants | Costa Rica | 25.4 /100 | #198 | Fair 12.2% |
| Portuguese | 25.1 /100 | #199 | Fair 12.2% |
| Sierra Leoneans | 23.6 /100 | #200 | Fair 12.2% |
| Ugandans | 22.5 /100 | #201 | Fair 12.2% |
| Immigrants | Venezuela | 20.1 /100 | #202 | Fair 12.3% |
| Shoshone | 17.7 /100 | #203 | Poor 12.4% |
| Immigrants | Nonimmigrants | 17.6 /100 | #204 | Poor 12.4% |
| Aleuts | 17.3 /100 | #205 | Poor 12.4% |
| Immigrants | Thailand | 17.0 /100 | #206 | Poor 12.4% |
| South Americans | 16.0 /100 | #207 | Poor 12.4% |
| Potawatomi | 14.6 /100 | #208 | Poor 12.5% |
| Immigrants | Sierra Leone | 12.9 /100 | #209 | Poor 12.5% |
| Immigrants | Uruguay | 12.8 /100 | #210 | Poor 12.5% |
| Colombians | 10.2 /100 | #211 | Poor 12.6% |