Cypriot vs Venezuelan Receiving Food Stamps
COMPARE
Cypriot
Venezuelan
Receiving Food Stamps
Receiving Food Stamps Comparison
Cypriots
Venezuelans
8.9%
RECEIVING FOOD STAMPS
99.9/ 100
METRIC RATING
12th/ 347
METRIC RANK
12.0%
RECEIVING FOOD STAMPS
32.1/ 100
METRIC RATING
191st/ 347
METRIC RANK
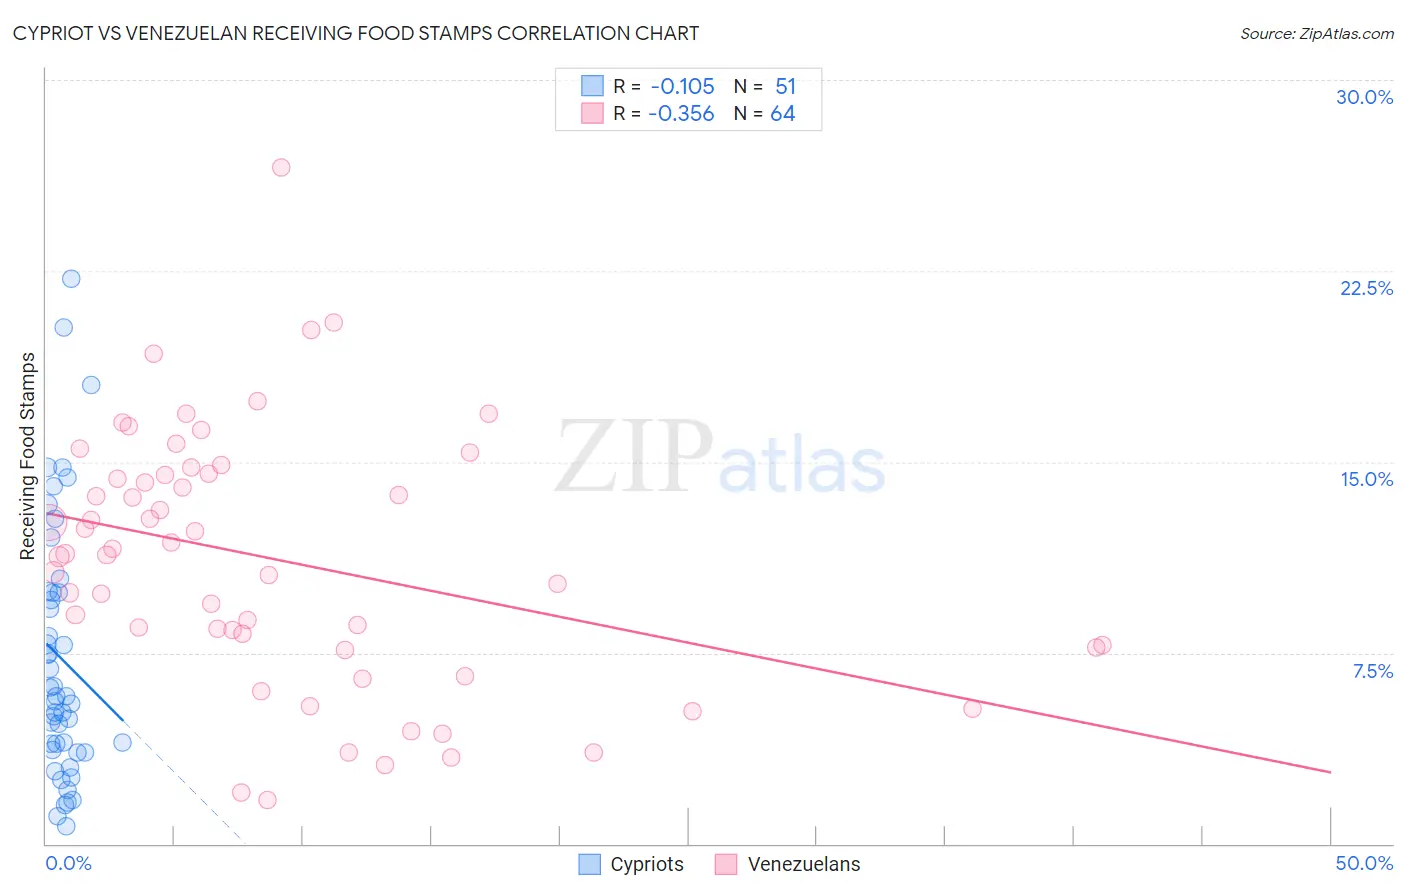
Cypriot vs Venezuelan Receiving Food Stamps Correlation Chart
The statistical analysis conducted on geographies consisting of 61,805,635 people shows a poor negative correlation between the proportion of Cypriots and percentage of population receiving government assistance and/or food stamps in the United States with a correlation coefficient (R) of -0.105 and weighted average of 8.9%. Similarly, the statistical analysis conducted on geographies consisting of 305,571,015 people shows a mild negative correlation between the proportion of Venezuelans and percentage of population receiving government assistance and/or food stamps in the United States with a correlation coefficient (R) of -0.356 and weighted average of 12.0%, a difference of 35.8%.
Receiving Food Stamps Correlation Summary
| Measurement | Cypriot | Venezuelan |
| Minimum | 0.70% | 1.7% |
| Maximum | 22.2% | 26.6% |
| Range | 21.5% | 24.9% |
| Mean | 7.3% | 11.1% |
| Median | 5.8% | 11.4% |
| Interquartile 25% (IQ1) | 3.7% | 7.7% |
| Interquartile 75% (IQ3) | 9.9% | 14.5% |
| Interquartile Range (IQR) | 6.2% | 6.8% |
| Standard Deviation (Sample) | 5.0% | 5.0% |
| Standard Deviation (Population) | 5.0% | 5.0% |
Similar Demographics by Receiving Food Stamps
Demographics Similar to Cypriots by Receiving Food Stamps
In terms of receiving food stamps, the demographic groups most similar to Cypriots are Okinawan (8.9%, a difference of 0.010%), Bulgarian (8.9%, a difference of 0.19%), Maltese (8.9%, a difference of 0.33%), Immigrants from South Central Asia (8.8%, a difference of 0.44%), and Norwegian (9.0%, a difference of 0.99%).
| Demographics | Rating | Rank | Receiving Food Stamps |
| Thais | 100.0 /100 | #5 | Exceptional 8.1% |
| Immigrants | Singapore | 100.0 /100 | #6 | Exceptional 8.3% |
| Immigrants | Iran | 100.0 /100 | #7 | Exceptional 8.3% |
| Burmese | 99.9 /100 | #8 | Exceptional 8.6% |
| Immigrants | Korea | 99.9 /100 | #9 | Exceptional 8.7% |
| Immigrants | South Central Asia | 99.9 /100 | #10 | Exceptional 8.8% |
| Okinawans | 99.9 /100 | #11 | Exceptional 8.9% |
| Cypriots | 99.9 /100 | #12 | Exceptional 8.9% |
| Bulgarians | 99.9 /100 | #13 | Exceptional 8.9% |
| Maltese | 99.9 /100 | #14 | Exceptional 8.9% |
| Norwegians | 99.9 /100 | #15 | Exceptional 9.0% |
| Immigrants | Japan | 99.9 /100 | #16 | Exceptional 9.0% |
| Immigrants | Scotland | 99.9 /100 | #17 | Exceptional 9.0% |
| Danes | 99.9 /100 | #18 | Exceptional 9.0% |
| Immigrants | Hong Kong | 99.8 /100 | #19 | Exceptional 9.1% |
Demographics Similar to Venezuelans by Receiving Food Stamps
In terms of receiving food stamps, the demographic groups most similar to Venezuelans are Immigrants from Peru (12.0%, a difference of 0.010%), Immigrants from Cameroon (12.0%, a difference of 0.060%), Samoan (12.1%, a difference of 0.18%), Sudanese (12.0%, a difference of 0.20%), and Albanian (12.0%, a difference of 0.51%).
| Demographics | Rating | Rank | Receiving Food Stamps |
| Spaniards | 39.8 /100 | #184 | Fair 11.9% |
| Immigrants | Iraq | 37.1 /100 | #185 | Fair 12.0% |
| Spanish | 36.9 /100 | #186 | Fair 12.0% |
| Albanians | 35.4 /100 | #187 | Fair 12.0% |
| Sudanese | 33.4 /100 | #188 | Fair 12.0% |
| Immigrants | Cameroon | 32.5 /100 | #189 | Fair 12.0% |
| Immigrants | Peru | 32.2 /100 | #190 | Fair 12.0% |
| Venezuelans | 32.1 /100 | #191 | Fair 12.0% |
| Samoans | 31.0 /100 | #192 | Fair 12.1% |
| Immigrants | Fiji | 27.8 /100 | #193 | Fair 12.1% |
| Immigrants | Sudan | 27.1 /100 | #194 | Fair 12.1% |
| Americans | 26.7 /100 | #195 | Fair 12.2% |
| Iraqis | 26.6 /100 | #196 | Fair 12.2% |
| Delaware | 26.1 /100 | #197 | Fair 12.2% |
| Immigrants | Costa Rica | 25.4 /100 | #198 | Fair 12.2% |