Paraguayan vs Cuban Receiving Food Stamps
COMPARE
Paraguayan
Cuban
Receiving Food Stamps
Receiving Food Stamps Comparison
Paraguayans
Cubans
10.7%
RECEIVING FOOD STAMPS
93.0/ 100
METRIC RATING
124th/ 347
METRIC RANK
18.2%
RECEIVING FOOD STAMPS
0.0/ 100
METRIC RATING
326th/ 347
METRIC RANK
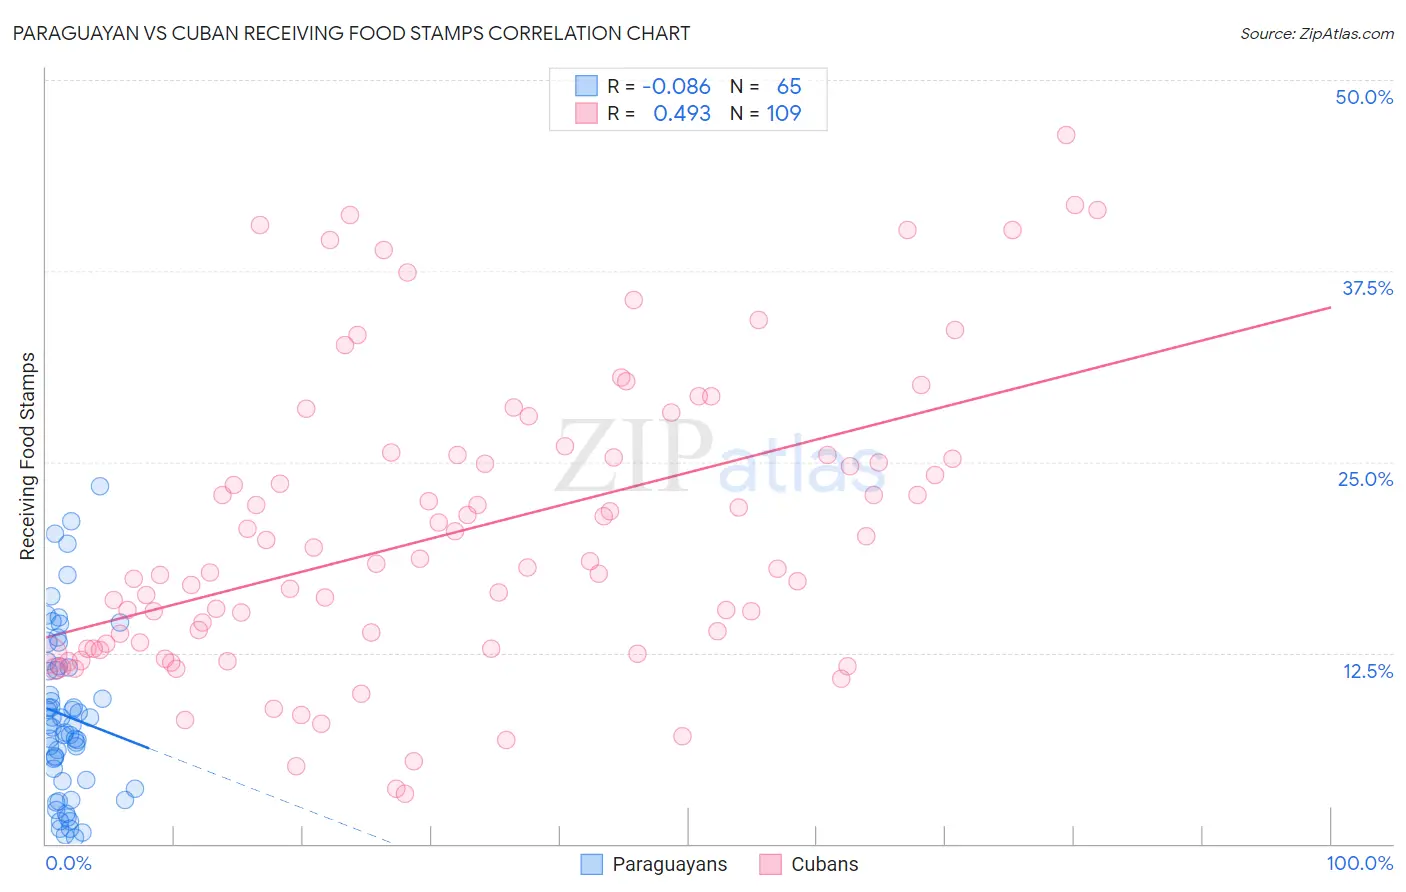
Paraguayan vs Cuban Receiving Food Stamps Correlation Chart
The statistical analysis conducted on geographies consisting of 95,051,783 people shows a slight negative correlation between the proportion of Paraguayans and percentage of population receiving government assistance and/or food stamps in the United States with a correlation coefficient (R) of -0.086 and weighted average of 10.7%. Similarly, the statistical analysis conducted on geographies consisting of 447,765,470 people shows a moderate positive correlation between the proportion of Cubans and percentage of population receiving government assistance and/or food stamps in the United States with a correlation coefficient (R) of 0.493 and weighted average of 18.2%, a difference of 70.7%.
Receiving Food Stamps Correlation Summary
| Measurement | Paraguayan | Cuban |
| Minimum | 0.40% | 3.3% |
| Maximum | 23.4% | 46.4% |
| Range | 23.0% | 43.1% |
| Mean | 8.4% | 20.4% |
| Median | 7.8% | 18.3% |
| Interquartile 25% (IQ1) | 4.2% | 12.8% |
| Interquartile 75% (IQ3) | 11.6% | 25.5% |
| Interquartile Range (IQR) | 7.4% | 12.7% |
| Standard Deviation (Sample) | 5.4% | 9.6% |
| Standard Deviation (Population) | 5.4% | 9.6% |
Similar Demographics by Receiving Food Stamps
Demographics Similar to Paraguayans by Receiving Food Stamps
In terms of receiving food stamps, the demographic groups most similar to Paraguayans are Ukrainian (10.7%, a difference of 0.080%), Immigrants from Philippines (10.7%, a difference of 0.21%), Afghan (10.7%, a difference of 0.22%), Immigrants from Ethiopia (10.7%, a difference of 0.25%), and Immigrants from Jordan (10.7%, a difference of 0.26%).
| Demographics | Rating | Rank | Receiving Food Stamps |
| Immigrants | Nepal | 94.6 /100 | #117 | Exceptional 10.6% |
| Assyrians/Chaldeans/Syriacs | 94.1 /100 | #118 | Exceptional 10.6% |
| Immigrants | Poland | 93.9 /100 | #119 | Exceptional 10.6% |
| Ethiopians | 93.9 /100 | #120 | Exceptional 10.6% |
| Slavs | 93.8 /100 | #121 | Exceptional 10.6% |
| Sri Lankans | 93.7 /100 | #122 | Exceptional 10.6% |
| Immigrants | Philippines | 93.3 /100 | #123 | Exceptional 10.7% |
| Paraguayans | 93.0 /100 | #124 | Exceptional 10.7% |
| Ukrainians | 92.8 /100 | #125 | Exceptional 10.7% |
| Afghans | 92.6 /100 | #126 | Exceptional 10.7% |
| Immigrants | Ethiopia | 92.6 /100 | #127 | Exceptional 10.7% |
| Immigrants | Jordan | 92.5 /100 | #128 | Exceptional 10.7% |
| Yugoslavians | 92.5 /100 | #129 | Exceptional 10.7% |
| Israelis | 92.4 /100 | #130 | Exceptional 10.7% |
| French | 92.3 /100 | #131 | Exceptional 10.7% |
Demographics Similar to Cubans by Receiving Food Stamps
In terms of receiving food stamps, the demographic groups most similar to Cubans are Immigrants from Haiti (18.2%, a difference of 0.11%), Apache (18.3%, a difference of 0.31%), Colville (18.3%, a difference of 0.52%), Immigrants from Dominica (18.4%, a difference of 0.98%), and British West Indian (17.9%, a difference of 1.9%).
| Demographics | Rating | Rank | Receiving Food Stamps |
| Immigrants | St. Vincent and the Grenadines | 0.0 /100 | #319 | Tragic 17.2% |
| Immigrants | Nicaragua | 0.0 /100 | #320 | Tragic 17.2% |
| Natives/Alaskans | 0.0 /100 | #321 | Tragic 17.3% |
| Immigrants | Grenada | 0.0 /100 | #322 | Tragic 17.8% |
| Haitians | 0.0 /100 | #323 | Tragic 17.8% |
| British West Indians | 0.0 /100 | #324 | Tragic 17.9% |
| Immigrants | Haiti | 0.0 /100 | #325 | Tragic 18.2% |
| Cubans | 0.0 /100 | #326 | Tragic 18.2% |
| Apache | 0.0 /100 | #327 | Tragic 18.3% |
| Colville | 0.0 /100 | #328 | Tragic 18.3% |
| Immigrants | Dominica | 0.0 /100 | #329 | Tragic 18.4% |
| Pima | 0.0 /100 | #330 | Tragic 19.0% |
| Immigrants | Caribbean | 0.0 /100 | #331 | Tragic 19.6% |
| Pueblo | 0.0 /100 | #332 | Tragic 19.9% |
| Inupiat | 0.0 /100 | #333 | Tragic 20.1% |