Immigrants from the Azores vs Venezuelan Receiving Food Stamps
COMPARE
Immigrants from the Azores
Venezuelan
Receiving Food Stamps
Receiving Food Stamps Comparison
Immigrants from the Azores
Venezuelans
16.4%
RECEIVING FOOD STAMPS
0.0/ 100
METRIC RATING
305th/ 347
METRIC RANK
12.0%
RECEIVING FOOD STAMPS
32.1/ 100
METRIC RATING
191st/ 347
METRIC RANK
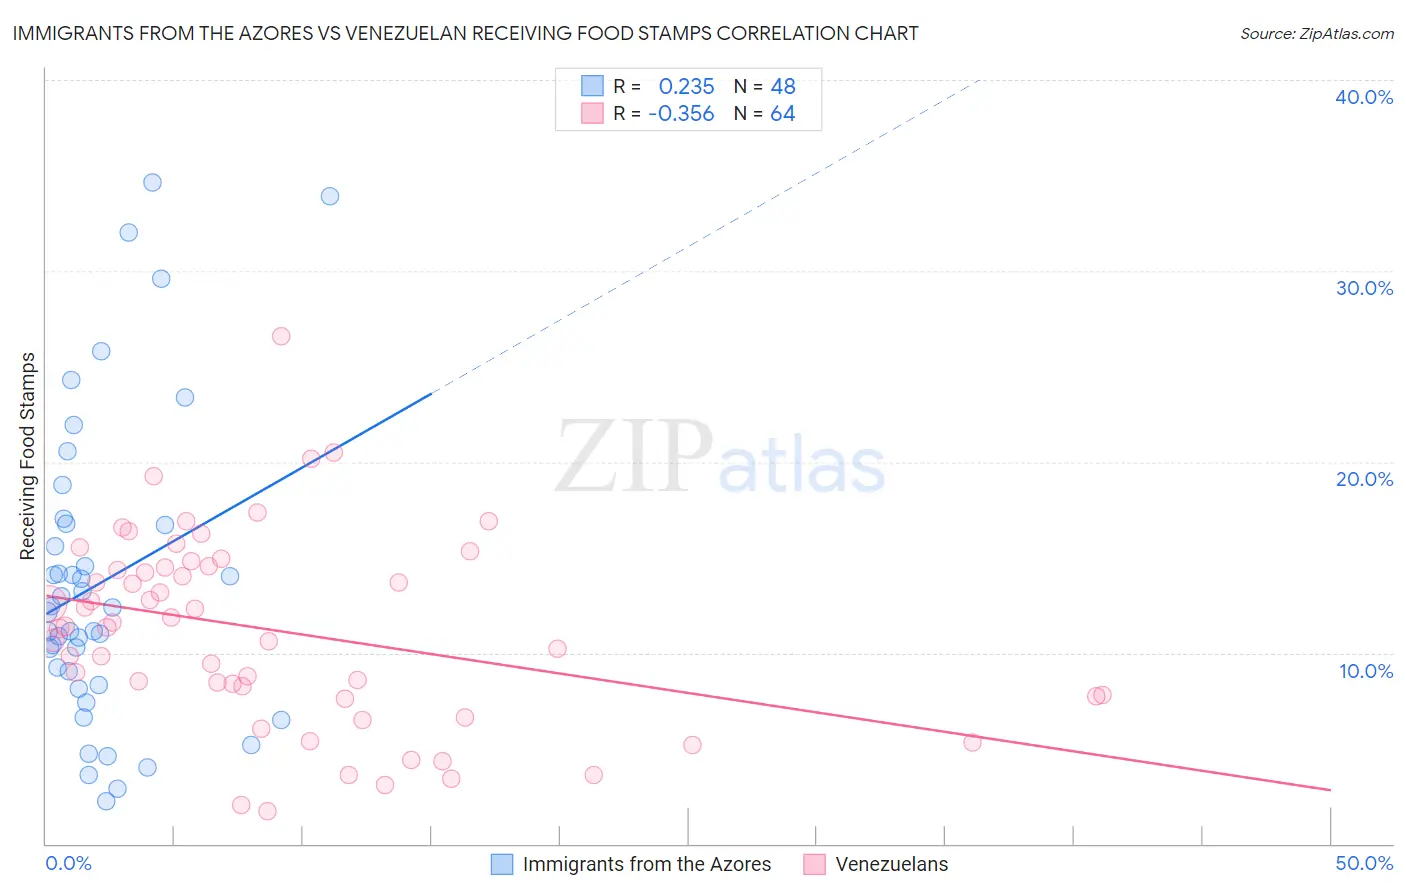
Immigrants from the Azores vs Venezuelan Receiving Food Stamps Correlation Chart
The statistical analysis conducted on geographies consisting of 46,243,454 people shows a weak positive correlation between the proportion of Immigrants from the Azores and percentage of population receiving government assistance and/or food stamps in the United States with a correlation coefficient (R) of 0.235 and weighted average of 16.4%. Similarly, the statistical analysis conducted on geographies consisting of 305,571,015 people shows a mild negative correlation between the proportion of Venezuelans and percentage of population receiving government assistance and/or food stamps in the United States with a correlation coefficient (R) of -0.356 and weighted average of 12.0%, a difference of 36.1%.
Receiving Food Stamps Correlation Summary
| Measurement | Immigrants from the Azores | Venezuelan |
| Minimum | 2.2% | 1.7% |
| Maximum | 34.6% | 26.6% |
| Range | 32.4% | 24.9% |
| Mean | 13.7% | 11.1% |
| Median | 12.3% | 11.4% |
| Interquartile 25% (IQ1) | 8.7% | 7.7% |
| Interquartile 75% (IQ3) | 16.7% | 14.5% |
| Interquartile Range (IQR) | 8.1% | 6.8% |
| Standard Deviation (Sample) | 7.9% | 5.0% |
| Standard Deviation (Population) | 7.9% | 5.0% |
Similar Demographics by Receiving Food Stamps
Demographics Similar to Immigrants from the Azores by Receiving Food Stamps
In terms of receiving food stamps, the demographic groups most similar to Immigrants from the Azores are Jamaican (16.4%, a difference of 0.070%), Houma (16.5%, a difference of 0.35%), Barbadian (16.5%, a difference of 0.62%), U.S. Virgin Islander (16.5%, a difference of 0.86%), and West Indian (16.3%, a difference of 0.88%).
| Demographics | Rating | Rank | Receiving Food Stamps |
| Immigrants | Trinidad and Tobago | 0.0 /100 | #298 | Tragic 15.8% |
| Hispanics or Latinos | 0.0 /100 | #299 | Tragic 15.8% |
| Immigrants | Bangladesh | 0.0 /100 | #300 | Tragic 15.9% |
| Trinidadians and Tobagonians | 0.0 /100 | #301 | Tragic 16.0% |
| Immigrants | West Indies | 0.0 /100 | #302 | Tragic 16.1% |
| Nicaraguans | 0.0 /100 | #303 | Tragic 16.1% |
| West Indians | 0.0 /100 | #304 | Tragic 16.3% |
| Immigrants | Azores | 0.0 /100 | #305 | Tragic 16.4% |
| Jamaicans | 0.0 /100 | #306 | Tragic 16.4% |
| Houma | 0.0 /100 | #307 | Tragic 16.5% |
| Barbadians | 0.0 /100 | #308 | Tragic 16.5% |
| U.S. Virgin Islanders | 0.0 /100 | #309 | Tragic 16.5% |
| Immigrants | Barbados | 0.0 /100 | #310 | Tragic 16.6% |
| Guyanese | 0.0 /100 | #311 | Tragic 16.7% |
| Sioux | 0.0 /100 | #312 | Tragic 16.8% |
Demographics Similar to Venezuelans by Receiving Food Stamps
In terms of receiving food stamps, the demographic groups most similar to Venezuelans are Immigrants from Peru (12.0%, a difference of 0.010%), Immigrants from Cameroon (12.0%, a difference of 0.060%), Samoan (12.1%, a difference of 0.18%), Sudanese (12.0%, a difference of 0.20%), and Albanian (12.0%, a difference of 0.51%).
| Demographics | Rating | Rank | Receiving Food Stamps |
| Spaniards | 39.8 /100 | #184 | Fair 11.9% |
| Immigrants | Iraq | 37.1 /100 | #185 | Fair 12.0% |
| Spanish | 36.9 /100 | #186 | Fair 12.0% |
| Albanians | 35.4 /100 | #187 | Fair 12.0% |
| Sudanese | 33.4 /100 | #188 | Fair 12.0% |
| Immigrants | Cameroon | 32.5 /100 | #189 | Fair 12.0% |
| Immigrants | Peru | 32.2 /100 | #190 | Fair 12.0% |
| Venezuelans | 32.1 /100 | #191 | Fair 12.0% |
| Samoans | 31.0 /100 | #192 | Fair 12.1% |
| Immigrants | Fiji | 27.8 /100 | #193 | Fair 12.1% |
| Immigrants | Sudan | 27.1 /100 | #194 | Fair 12.1% |
| Americans | 26.7 /100 | #195 | Fair 12.2% |
| Iraqis | 26.6 /100 | #196 | Fair 12.2% |
| Delaware | 26.1 /100 | #197 | Fair 12.2% |
| Immigrants | Costa Rica | 25.4 /100 | #198 | Fair 12.2% |