Paraguayan vs Menominee Male Poverty
COMPARE
Paraguayan
Menominee
Male Poverty
Male Poverty Comparison
Paraguayans
Menominee
10.2%
MALE POVERTY
97.1/ 100
METRIC RATING
70th/ 347
METRIC RANK
15.3%
MALE POVERTY
0.0/ 100
METRIC RATING
324th/ 347
METRIC RANK
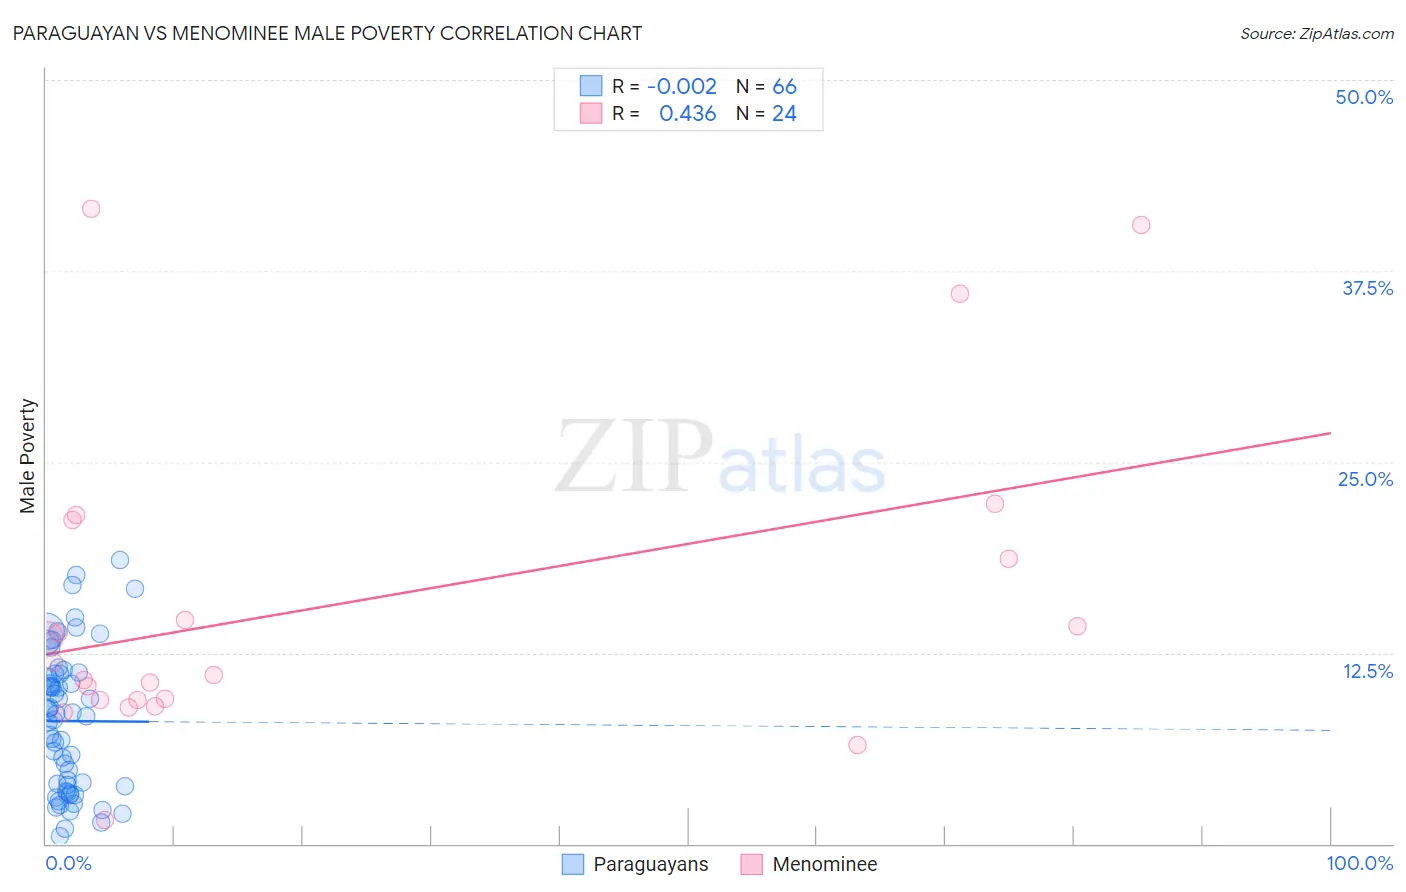
Paraguayan vs Menominee Male Poverty Correlation Chart
The statistical analysis conducted on geographies consisting of 95,091,080 people shows no correlation between the proportion of Paraguayans and poverty level among males in the United States with a correlation coefficient (R) of -0.002 and weighted average of 10.2%. Similarly, the statistical analysis conducted on geographies consisting of 45,777,105 people shows a moderate positive correlation between the proportion of Menominee and poverty level among males in the United States with a correlation coefficient (R) of 0.436 and weighted average of 15.3%, a difference of 49.4%.
Male Poverty Correlation Summary
| Measurement | Paraguayan | Menominee |
| Minimum | 0.50% | 1.6% |
| Maximum | 18.6% | 41.6% |
| Range | 18.1% | 40.0% |
| Mean | 8.0% | 15.6% |
| Median | 8.4% | 11.5% |
| Interquartile 25% (IQ1) | 3.8% | 9.4% |
| Interquartile 75% (IQ3) | 11.1% | 19.9% |
| Interquartile Range (IQR) | 7.4% | 10.5% |
| Standard Deviation (Sample) | 4.6% | 10.4% |
| Standard Deviation (Population) | 4.5% | 10.2% |
Similar Demographics by Male Poverty
Demographics Similar to Paraguayans by Male Poverty
In terms of male poverty, the demographic groups most similar to Paraguayans are Immigrants from Australia (10.2%, a difference of 0.020%), European (10.2%, a difference of 0.030%), Immigrants from Canada (10.2%, a difference of 0.030%), Immigrants from Asia (10.2%, a difference of 0.12%), and Immigrants from Sri Lanka (10.2%, a difference of 0.15%).
| Demographics | Rating | Rank | Male Poverty |
| Slovaks | 97.7 /100 | #63 | Exceptional 10.2% |
| Swiss | 97.5 /100 | #64 | Exceptional 10.2% |
| Zimbabweans | 97.5 /100 | #65 | Exceptional 10.2% |
| Serbians | 97.5 /100 | #66 | Exceptional 10.2% |
| Immigrants | Netherlands | 97.3 /100 | #67 | Exceptional 10.2% |
| Immigrants | Sri Lanka | 97.2 /100 | #68 | Exceptional 10.2% |
| Immigrants | Australia | 97.1 /100 | #69 | Exceptional 10.2% |
| Paraguayans | 97.1 /100 | #70 | Exceptional 10.2% |
| Europeans | 97.1 /100 | #71 | Exceptional 10.2% |
| Immigrants | Canada | 97.1 /100 | #72 | Exceptional 10.2% |
| Immigrants | Asia | 97.0 /100 | #73 | Exceptional 10.2% |
| Immigrants | Eastern Europe | 96.9 /100 | #74 | Exceptional 10.2% |
| Carpatho Rusyns | 96.9 /100 | #75 | Exceptional 10.2% |
| Dutch | 96.9 /100 | #76 | Exceptional 10.2% |
| Immigrants | Belgium | 96.8 /100 | #77 | Exceptional 10.3% |
Demographics Similar to Menominee by Male Poverty
In terms of male poverty, the demographic groups most similar to Menominee are Yakama (15.3%, a difference of 0.18%), Colville (15.2%, a difference of 0.19%), Central American Indian (15.3%, a difference of 0.29%), Kiowa (15.2%, a difference of 0.58%), and Arapaho (15.1%, a difference of 1.3%).
| Demographics | Rating | Rank | Male Poverty |
| Immigrants | Dominica | 0.0 /100 | #317 | Tragic 14.7% |
| Immigrants | Grenada | 0.0 /100 | #318 | Tragic 14.7% |
| U.S. Virgin Islanders | 0.0 /100 | #319 | Tragic 14.7% |
| Immigrants | Congo | 0.0 /100 | #320 | Tragic 14.7% |
| Arapaho | 0.0 /100 | #321 | Tragic 15.1% |
| Kiowa | 0.0 /100 | #322 | Tragic 15.2% |
| Colville | 0.0 /100 | #323 | Tragic 15.2% |
| Menominee | 0.0 /100 | #324 | Tragic 15.3% |
| Yakama | 0.0 /100 | #325 | Tragic 15.3% |
| Central American Indians | 0.0 /100 | #326 | Tragic 15.3% |
| Paiute | 0.0 /100 | #327 | Tragic 15.8% |
| Blacks/African Americans | 0.0 /100 | #328 | Tragic 15.8% |
| Dominicans | 0.0 /100 | #329 | Tragic 16.1% |
| Immigrants | Dominican Republic | 0.0 /100 | #330 | Tragic 16.2% |
| Ute | 0.0 /100 | #331 | Tragic 16.2% |