Immigrants from Israel vs Tsimshian Male Poverty
COMPARE
Immigrants from Israel
Tsimshian
Male Poverty
Male Poverty Comparison
Immigrants from Israel
Tsimshian
10.8%
MALE POVERTY
80.9/ 100
METRIC RATING
136th/ 347
METRIC RANK
12.8%
MALE POVERTY
0.3/ 100
METRIC RATING
244th/ 347
METRIC RANK
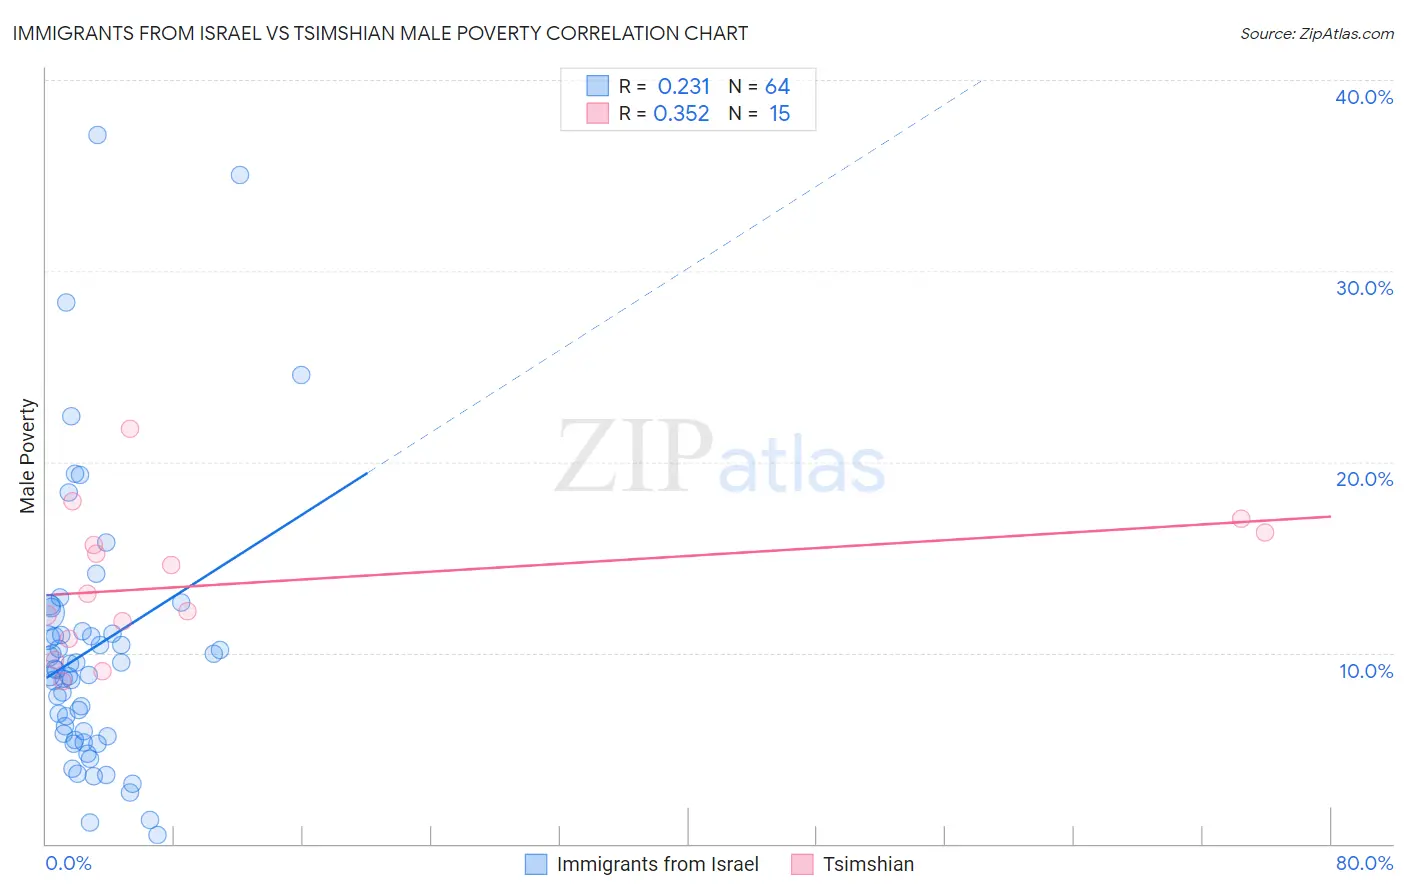
Immigrants from Israel vs Tsimshian Male Poverty Correlation Chart
The statistical analysis conducted on geographies consisting of 209,930,227 people shows a weak positive correlation between the proportion of Immigrants from Israel and poverty level among males in the United States with a correlation coefficient (R) of 0.231 and weighted average of 10.8%. Similarly, the statistical analysis conducted on geographies consisting of 15,624,889 people shows a mild positive correlation between the proportion of Tsimshian and poverty level among males in the United States with a correlation coefficient (R) of 0.352 and weighted average of 12.8%, a difference of 18.6%.
Male Poverty Correlation Summary
| Measurement | Immigrants from Israel | Tsimshian |
| Minimum | 0.49% | 8.5% |
| Maximum | 37.1% | 21.8% |
| Range | 36.6% | 13.2% |
| Mean | 10.2% | 13.7% |
| Median | 9.1% | 13.1% |
| Interquartile 25% (IQ1) | 5.7% | 10.7% |
| Interquartile 75% (IQ3) | 11.1% | 16.3% |
| Interquartile Range (IQR) | 5.4% | 5.6% |
| Standard Deviation (Sample) | 7.1% | 3.7% |
| Standard Deviation (Population) | 7.0% | 3.6% |
Similar Demographics by Male Poverty
Demographics Similar to Immigrants from Israel by Male Poverty
In terms of male poverty, the demographic groups most similar to Immigrants from Israel are Immigrants from Switzerland (10.8%, a difference of 0.26%), Brazilian (10.8%, a difference of 0.31%), New Zealander (10.8%, a difference of 0.35%), Pakistani (10.8%, a difference of 0.36%), and Immigrants from Vietnam (10.8%, a difference of 0.37%).
| Demographics | Rating | Rank | Male Poverty |
| Immigrants | Peru | 84.1 /100 | #129 | Excellent 10.7% |
| Chileans | 83.9 /100 | #130 | Excellent 10.7% |
| Immigrants | Belarus | 83.3 /100 | #131 | Excellent 10.7% |
| Immigrants | Vietnam | 83.0 /100 | #132 | Excellent 10.8% |
| Pakistanis | 83.0 /100 | #133 | Excellent 10.8% |
| New Zealanders | 82.9 /100 | #134 | Excellent 10.8% |
| Brazilians | 82.7 /100 | #135 | Excellent 10.8% |
| Immigrants | Israel | 80.9 /100 | #136 | Excellent 10.8% |
| Immigrants | Switzerland | 79.2 /100 | #137 | Good 10.8% |
| Yugoslavians | 78.2 /100 | #138 | Good 10.8% |
| Immigrants | Jordan | 77.5 /100 | #139 | Good 10.8% |
| Tlingit-Haida | 76.1 /100 | #140 | Good 10.9% |
| Immigrants | France | 75.8 /100 | #141 | Good 10.9% |
| Basques | 74.6 /100 | #142 | Good 10.9% |
| Afghans | 71.9 /100 | #143 | Good 10.9% |
Demographics Similar to Tsimshian by Male Poverty
In terms of male poverty, the demographic groups most similar to Tsimshian are Liberian (12.8%, a difference of 0.010%), Alaskan Athabascan (12.8%, a difference of 0.11%), Nepalese (12.8%, a difference of 0.14%), Sudanese (12.8%, a difference of 0.31%), and Immigrants from El Salvador (12.8%, a difference of 0.32%).
| Demographics | Rating | Rank | Male Poverty |
| French American Indians | 0.4 /100 | #237 | Tragic 12.7% |
| Ecuadorians | 0.4 /100 | #238 | Tragic 12.7% |
| Ghanaians | 0.4 /100 | #239 | Tragic 12.7% |
| Immigrants | Middle Africa | 0.4 /100 | #240 | Tragic 12.7% |
| Sudanese | 0.3 /100 | #241 | Tragic 12.8% |
| Nepalese | 0.3 /100 | #242 | Tragic 12.8% |
| Alaskan Athabascans | 0.3 /100 | #243 | Tragic 12.8% |
| Tsimshian | 0.3 /100 | #244 | Tragic 12.8% |
| Liberians | 0.3 /100 | #245 | Tragic 12.8% |
| Immigrants | El Salvador | 0.2 /100 | #246 | Tragic 12.8% |
| Immigrants | Western Africa | 0.2 /100 | #247 | Tragic 12.9% |
| Immigrants | Sudan | 0.2 /100 | #248 | Tragic 12.9% |
| Potawatomi | 0.2 /100 | #249 | Tragic 12.9% |
| Immigrants | Nicaragua | 0.2 /100 | #250 | Tragic 12.9% |
| Immigrants | Cuba | 0.2 /100 | #251 | Tragic 12.9% |