Basque vs Tsimshian Male Poverty
COMPARE
Basque
Tsimshian
Male Poverty
Male Poverty Comparison
Basques
Tsimshian
10.9%
MALE POVERTY
74.6/ 100
METRIC RATING
142nd/ 347
METRIC RANK
12.8%
MALE POVERTY
0.3/ 100
METRIC RATING
244th/ 347
METRIC RANK
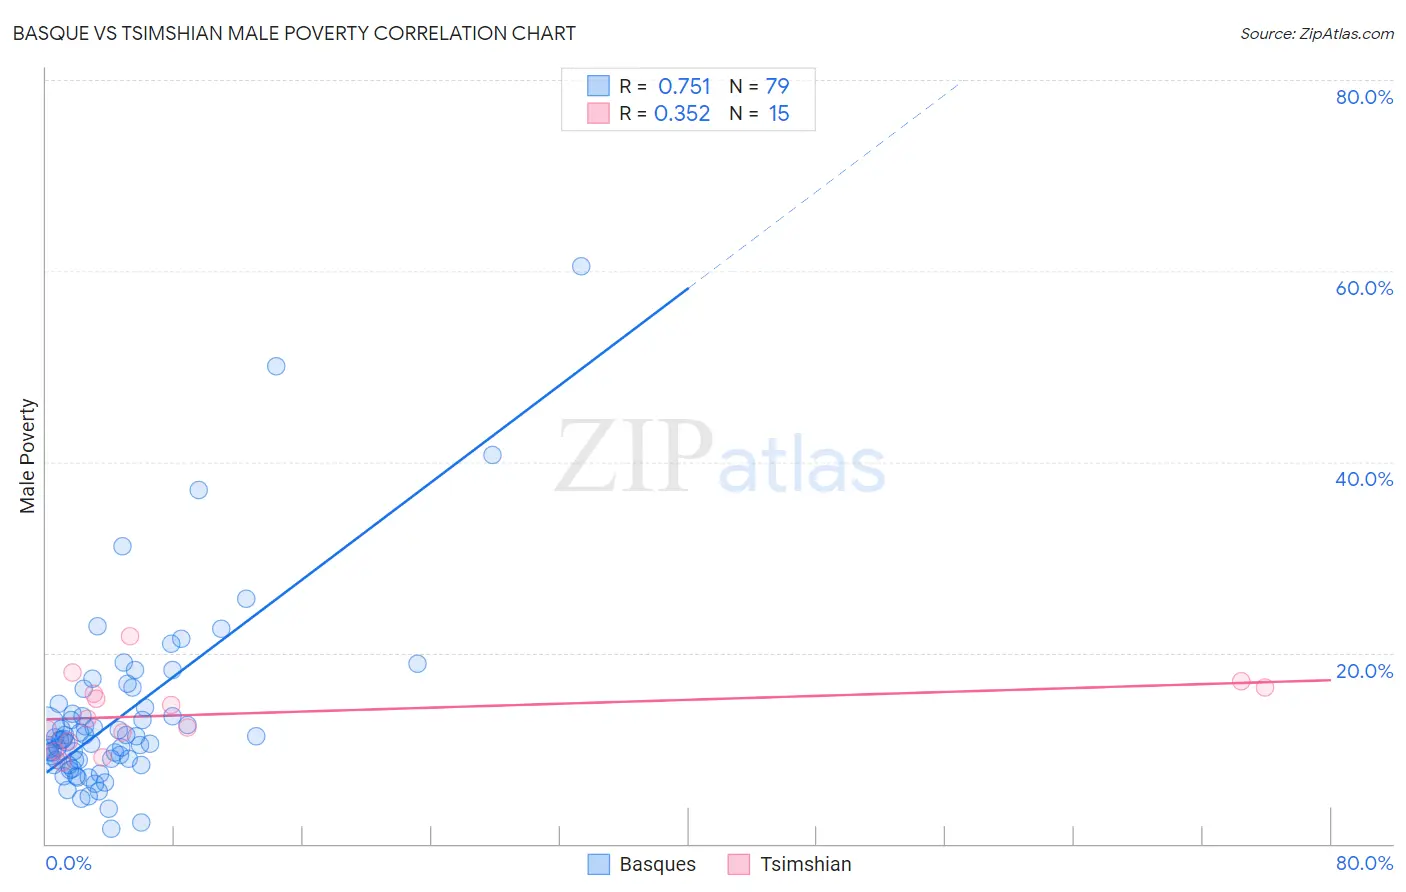
Basque vs Tsimshian Male Poverty Correlation Chart
The statistical analysis conducted on geographies consisting of 165,709,169 people shows a strong positive correlation between the proportion of Basques and poverty level among males in the United States with a correlation coefficient (R) of 0.751 and weighted average of 10.9%. Similarly, the statistical analysis conducted on geographies consisting of 15,624,889 people shows a mild positive correlation between the proportion of Tsimshian and poverty level among males in the United States with a correlation coefficient (R) of 0.352 and weighted average of 12.8%, a difference of 17.5%.
Male Poverty Correlation Summary
| Measurement | Basque | Tsimshian |
| Minimum | 1.5% | 8.5% |
| Maximum | 60.5% | 21.8% |
| Range | 59.0% | 13.2% |
| Mean | 13.3% | 13.7% |
| Median | 10.9% | 13.1% |
| Interquartile 25% (IQ1) | 8.7% | 10.7% |
| Interquartile 75% (IQ3) | 14.3% | 16.3% |
| Interquartile Range (IQR) | 5.6% | 5.6% |
| Standard Deviation (Sample) | 9.6% | 3.7% |
| Standard Deviation (Population) | 9.5% | 3.6% |
Similar Demographics by Male Poverty
Demographics Similar to Basques by Male Poverty
In terms of male poverty, the demographic groups most similar to Basques are Immigrants from France (10.9%, a difference of 0.17%), Tlingit-Haida (10.9%, a difference of 0.20%), Afghan (10.9%, a difference of 0.34%), Samoan (10.9%, a difference of 0.36%), and Immigrants from Germany (10.9%, a difference of 0.38%).
| Demographics | Rating | Rank | Male Poverty |
| Brazilians | 82.7 /100 | #135 | Excellent 10.8% |
| Immigrants | Israel | 80.9 /100 | #136 | Excellent 10.8% |
| Immigrants | Switzerland | 79.2 /100 | #137 | Good 10.8% |
| Yugoslavians | 78.2 /100 | #138 | Good 10.8% |
| Immigrants | Jordan | 77.5 /100 | #139 | Good 10.8% |
| Tlingit-Haida | 76.1 /100 | #140 | Good 10.9% |
| Immigrants | France | 75.8 /100 | #141 | Good 10.9% |
| Basques | 74.6 /100 | #142 | Good 10.9% |
| Afghans | 71.9 /100 | #143 | Good 10.9% |
| Samoans | 71.8 /100 | #144 | Good 10.9% |
| Immigrants | Germany | 71.6 /100 | #145 | Good 10.9% |
| Syrians | 71.4 /100 | #146 | Good 10.9% |
| Icelanders | 68.5 /100 | #147 | Good 11.0% |
| Armenians | 68.0 /100 | #148 | Good 11.0% |
| Immigrants | Venezuela | 67.9 /100 | #149 | Good 11.0% |
Demographics Similar to Tsimshian by Male Poverty
In terms of male poverty, the demographic groups most similar to Tsimshian are Liberian (12.8%, a difference of 0.010%), Alaskan Athabascan (12.8%, a difference of 0.11%), Nepalese (12.8%, a difference of 0.14%), Sudanese (12.8%, a difference of 0.31%), and Immigrants from El Salvador (12.8%, a difference of 0.32%).
| Demographics | Rating | Rank | Male Poverty |
| French American Indians | 0.4 /100 | #237 | Tragic 12.7% |
| Ecuadorians | 0.4 /100 | #238 | Tragic 12.7% |
| Ghanaians | 0.4 /100 | #239 | Tragic 12.7% |
| Immigrants | Middle Africa | 0.4 /100 | #240 | Tragic 12.7% |
| Sudanese | 0.3 /100 | #241 | Tragic 12.8% |
| Nepalese | 0.3 /100 | #242 | Tragic 12.8% |
| Alaskan Athabascans | 0.3 /100 | #243 | Tragic 12.8% |
| Tsimshian | 0.3 /100 | #244 | Tragic 12.8% |
| Liberians | 0.3 /100 | #245 | Tragic 12.8% |
| Immigrants | El Salvador | 0.2 /100 | #246 | Tragic 12.8% |
| Immigrants | Western Africa | 0.2 /100 | #247 | Tragic 12.9% |
| Immigrants | Sudan | 0.2 /100 | #248 | Tragic 12.9% |
| Potawatomi | 0.2 /100 | #249 | Tragic 12.9% |
| Immigrants | Nicaragua | 0.2 /100 | #250 | Tragic 12.9% |
| Immigrants | Cuba | 0.2 /100 | #251 | Tragic 12.9% |