Paraguayan vs Immigrants from Malaysia Female Poverty
COMPARE
Paraguayan
Immigrants from Malaysia
Female Poverty
Female Poverty Comparison
Paraguayans
Immigrants from Malaysia
12.6%
FEMALE POVERTY
93.0/ 100
METRIC RATING
110th/ 347
METRIC RANK
13.0%
FEMALE POVERTY
80.4/ 100
METRIC RATING
143rd/ 347
METRIC RANK
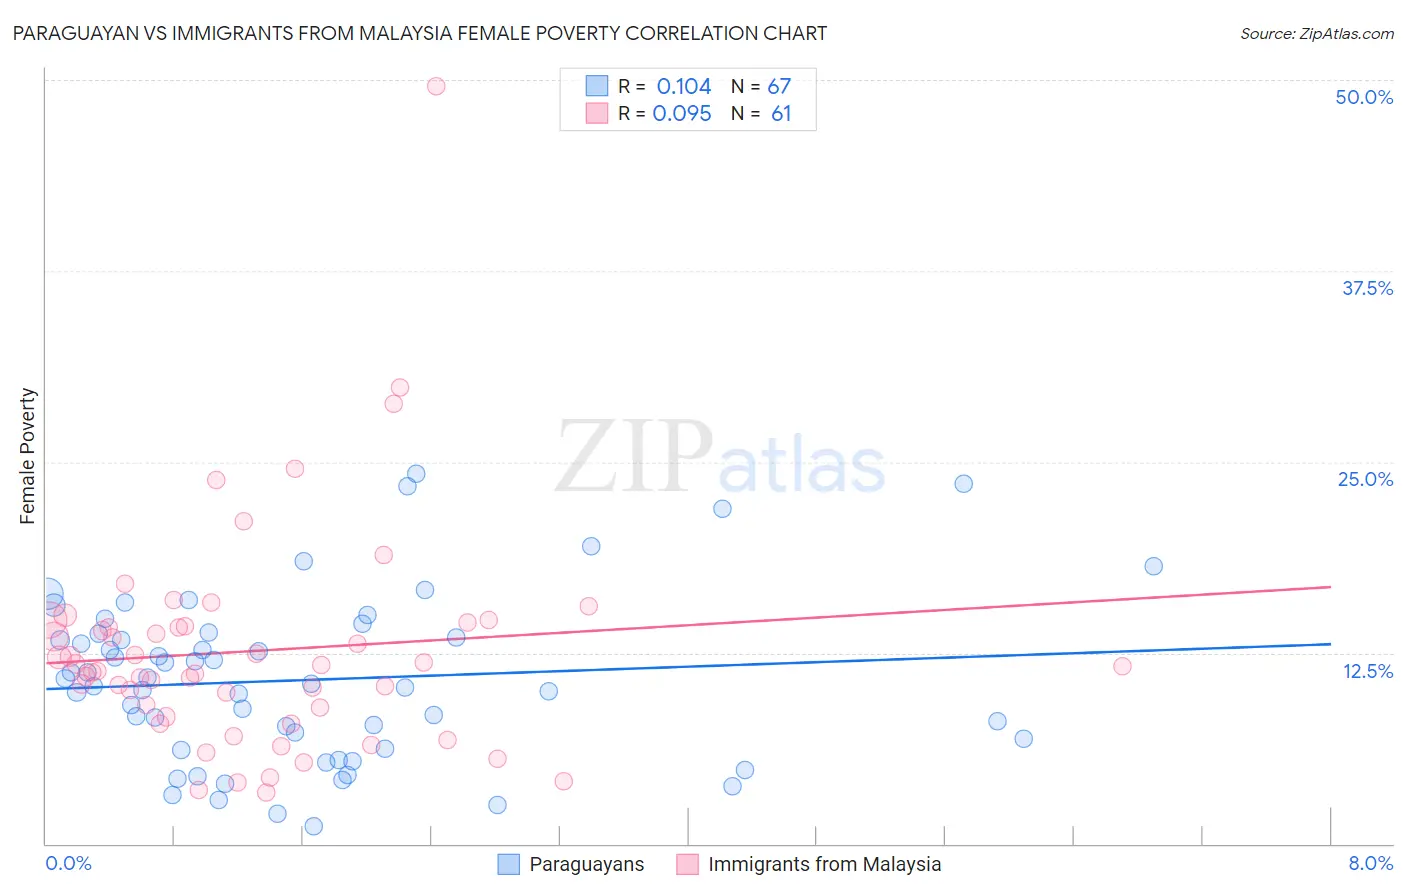
Paraguayan vs Immigrants from Malaysia Female Poverty Correlation Chart
The statistical analysis conducted on geographies consisting of 95,097,647 people shows a poor positive correlation between the proportion of Paraguayans and poverty level among females in the United States with a correlation coefficient (R) of 0.104 and weighted average of 12.6%. Similarly, the statistical analysis conducted on geographies consisting of 197,903,089 people shows a slight positive correlation between the proportion of Immigrants from Malaysia and poverty level among females in the United States with a correlation coefficient (R) of 0.095 and weighted average of 13.0%, a difference of 3.0%.
Female Poverty Correlation Summary
| Measurement | Paraguayan | Immigrants from Malaysia |
| Minimum | 1.2% | 3.4% |
| Maximum | 24.2% | 49.6% |
| Range | 23.0% | 46.2% |
| Mean | 10.7% | 12.6% |
| Median | 10.5% | 11.6% |
| Interquartile 25% (IQ1) | 6.2% | 8.6% |
| Interquartile 75% (IQ3) | 13.8% | 14.3% |
| Interquartile Range (IQR) | 7.6% | 5.7% |
| Standard Deviation (Sample) | 5.4% | 7.3% |
| Standard Deviation (Population) | 5.4% | 7.2% |
Similar Demographics by Female Poverty
Demographics Similar to Paraguayans by Female Poverty
In terms of female poverty, the demographic groups most similar to Paraguayans are Immigrants from Zimbabwe (12.6%, a difference of 0.030%), Portuguese (12.6%, a difference of 0.040%), Laotian (12.6%, a difference of 0.15%), Soviet Union (12.6%, a difference of 0.22%), and Immigrants from Turkey (12.6%, a difference of 0.33%).
| Demographics | Rating | Rank | Female Poverty |
| Slavs | 94.5 /100 | #103 | Exceptional 12.5% |
| Palestinians | 94.3 /100 | #104 | Exceptional 12.5% |
| Scottish | 94.1 /100 | #105 | Exceptional 12.5% |
| Immigrants | Turkey | 93.8 /100 | #106 | Exceptional 12.6% |
| Laotians | 93.4 /100 | #107 | Exceptional 12.6% |
| Portuguese | 93.1 /100 | #108 | Exceptional 12.6% |
| Immigrants | Zimbabwe | 93.1 /100 | #109 | Exceptional 12.6% |
| Paraguayans | 93.0 /100 | #110 | Exceptional 12.6% |
| Soviet Union | 92.4 /100 | #111 | Exceptional 12.6% |
| Immigrants | Israel | 92.0 /100 | #112 | Exceptional 12.6% |
| Canadians | 92.0 /100 | #113 | Exceptional 12.7% |
| Welsh | 91.6 /100 | #114 | Exceptional 12.7% |
| Puget Sound Salish | 91.5 /100 | #115 | Exceptional 12.7% |
| Immigrants | Russia | 91.2 /100 | #116 | Exceptional 12.7% |
| Immigrants | Southern Europe | 90.9 /100 | #117 | Exceptional 12.7% |
Demographics Similar to Immigrants from Malaysia by Female Poverty
In terms of female poverty, the demographic groups most similar to Immigrants from Malaysia are Brazilian (13.0%, a difference of 0.020%), Afghan (13.0%, a difference of 0.090%), Icelander (13.0%, a difference of 0.12%), Syrian (13.0%, a difference of 0.12%), and Immigrants from Peru (13.0%, a difference of 0.19%).
| Demographics | Rating | Rank | Female Poverty |
| Peruvians | 85.2 /100 | #136 | Excellent 12.9% |
| Chileans | 84.7 /100 | #137 | Excellent 12.9% |
| Immigrants | France | 83.6 /100 | #138 | Excellent 12.9% |
| Basques | 83.1 /100 | #139 | Excellent 12.9% |
| Pakistanis | 83.0 /100 | #140 | Excellent 12.9% |
| Icelanders | 81.1 /100 | #141 | Excellent 13.0% |
| Brazilians | 80.5 /100 | #142 | Excellent 13.0% |
| Immigrants | Malaysia | 80.4 /100 | #143 | Excellent 13.0% |
| Afghans | 79.8 /100 | #144 | Good 13.0% |
| Syrians | 79.6 /100 | #145 | Good 13.0% |
| Immigrants | Peru | 79.1 /100 | #146 | Good 13.0% |
| Immigrants | Kazakhstan | 78.6 /100 | #147 | Good 13.0% |
| Yugoslavians | 76.9 /100 | #148 | Good 13.1% |
| Taiwanese | 75.7 /100 | #149 | Good 13.1% |
| Tsimshian | 75.5 /100 | #150 | Good 13.1% |