Paraguayan vs Immigrants from Malaysia Unemployment Among Women with Children Ages 6 to 17 years
COMPARE
Paraguayan
Immigrants from Malaysia
Unemployment Among Women with Children Ages 6 to 17 years
Unemployment Among Women with Children Ages 6 to 17 years Comparison
Paraguayans
Immigrants from Malaysia
10.2%
UNEMPLOYMENT AMONG WOMEN WITH CHILDREN AGES 6 TO 17 YEARS
0.0/ 100
METRIC RATING
306th/ 347
METRIC RANK
8.2%
UNEMPLOYMENT AMONG WOMEN WITH CHILDREN AGES 6 TO 17 YEARS
100.0/ 100
METRIC RATING
58th/ 347
METRIC RANK
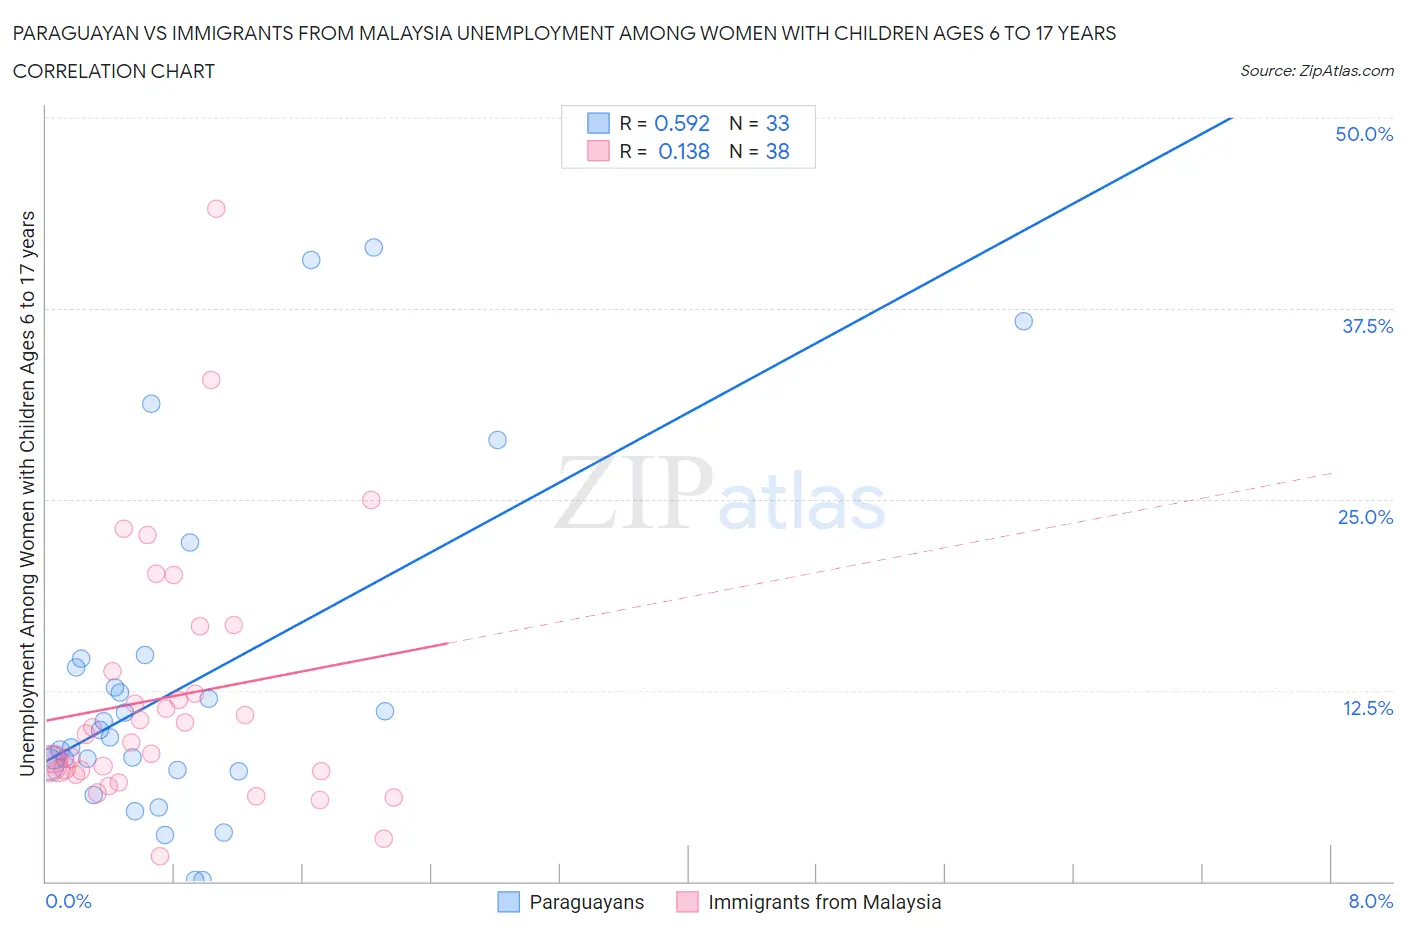
Paraguayan vs Immigrants from Malaysia Unemployment Among Women with Children Ages 6 to 17 years Correlation Chart
The statistical analysis conducted on geographies consisting of 81,717,447 people shows a substantial positive correlation between the proportion of Paraguayans and unemployment rate among women with children between the ages 6 and 17 in the United States with a correlation coefficient (R) of 0.592 and weighted average of 10.2%. Similarly, the statistical analysis conducted on geographies consisting of 160,783,696 people shows a poor positive correlation between the proportion of Immigrants from Malaysia and unemployment rate among women with children between the ages 6 and 17 in the United States with a correlation coefficient (R) of 0.138 and weighted average of 8.2%, a difference of 25.0%.
Unemployment Among Women with Children Ages 6 to 17 years Correlation Summary
| Measurement | Paraguayan | Immigrants from Malaysia |
| Minimum | 0.10% | 1.6% |
| Maximum | 41.5% | 44.0% |
| Range | 41.4% | 42.4% |
| Mean | 12.9% | 12.0% |
| Median | 9.4% | 9.4% |
| Interquartile 25% (IQ1) | 7.2% | 7.2% |
| Interquartile 75% (IQ3) | 14.3% | 13.8% |
| Interquartile Range (IQR) | 7.0% | 6.6% |
| Standard Deviation (Sample) | 10.9% | 8.5% |
| Standard Deviation (Population) | 10.7% | 8.4% |
Similar Demographics by Unemployment Among Women with Children Ages 6 to 17 years
Demographics Similar to Paraguayans by Unemployment Among Women with Children Ages 6 to 17 years
In terms of unemployment among women with children ages 6 to 17 years, the demographic groups most similar to Paraguayans are Immigrants from Senegal (10.2%, a difference of 0.23%), Dutch West Indian (10.2%, a difference of 0.24%), Immigrants from Nigeria (10.2%, a difference of 0.29%), Immigrants from Venezuela (10.2%, a difference of 0.35%), and Immigrants from Ecuador (10.2%, a difference of 0.44%).
| Demographics | Rating | Rank | Unemployment Among Women with Children Ages 6 to 17 years |
| Immigrants | Honduras | 0.0 /100 | #299 | Tragic 10.1% |
| Nigerians | 0.0 /100 | #300 | Tragic 10.1% |
| Immigrants | Bahamas | 0.0 /100 | #301 | Tragic 10.1% |
| Venezuelans | 0.0 /100 | #302 | Tragic 10.2% |
| Immigrants | Ecuador | 0.0 /100 | #303 | Tragic 10.2% |
| Immigrants | Venezuela | 0.0 /100 | #304 | Tragic 10.2% |
| Immigrants | Nigeria | 0.0 /100 | #305 | Tragic 10.2% |
| Paraguayans | 0.0 /100 | #306 | Tragic 10.2% |
| Immigrants | Senegal | 0.0 /100 | #307 | Tragic 10.2% |
| Dutch West Indians | 0.0 /100 | #308 | Tragic 10.2% |
| French Canadians | 0.0 /100 | #309 | Tragic 10.3% |
| Alaska Natives | 0.0 /100 | #310 | Tragic 10.3% |
| Immigrants | Liberia | 0.0 /100 | #311 | Tragic 10.3% |
| Africans | 0.0 /100 | #312 | Tragic 10.4% |
| Americans | 0.0 /100 | #313 | Tragic 10.4% |
Demographics Similar to Immigrants from Malaysia by Unemployment Among Women with Children Ages 6 to 17 years
In terms of unemployment among women with children ages 6 to 17 years, the demographic groups most similar to Immigrants from Malaysia are Immigrants from Philippines (8.2%, a difference of 0.060%), Basque (8.2%, a difference of 0.070%), Immigrants from Laos (8.2%, a difference of 0.19%), Immigrants from Bosnia and Herzegovina (8.2%, a difference of 0.21%), and Immigrants from Japan (8.2%, a difference of 0.23%).
| Demographics | Rating | Rank | Unemployment Among Women with Children Ages 6 to 17 years |
| Immigrants | Sudan | 100.0 /100 | #51 | Exceptional 8.1% |
| Immigrants | Iraq | 100.0 /100 | #52 | Exceptional 8.1% |
| Danes | 100.0 /100 | #53 | Exceptional 8.1% |
| Immigrants | Armenia | 100.0 /100 | #54 | Exceptional 8.2% |
| Immigrants | Japan | 100.0 /100 | #55 | Exceptional 8.2% |
| Immigrants | Bosnia and Herzegovina | 100.0 /100 | #56 | Exceptional 8.2% |
| Immigrants | Laos | 100.0 /100 | #57 | Exceptional 8.2% |
| Immigrants | Malaysia | 100.0 /100 | #58 | Exceptional 8.2% |
| Immigrants | Philippines | 100.0 /100 | #59 | Exceptional 8.2% |
| Basques | 100.0 /100 | #60 | Exceptional 8.2% |
| Koreans | 100.0 /100 | #61 | Exceptional 8.2% |
| Spanish American Indians | 100.0 /100 | #62 | Exceptional 8.2% |
| Immigrants | South Eastern Asia | 99.9 /100 | #63 | Exceptional 8.2% |
| Immigrants | Kuwait | 99.9 /100 | #64 | Exceptional 8.3% |
| Immigrants | Albania | 99.9 /100 | #65 | Exceptional 8.3% |