Paraguayan vs Immigrants from Albania Female Poverty
COMPARE
Paraguayan
Immigrants from Albania
Female Poverty
Female Poverty Comparison
Paraguayans
Immigrants from Albania
12.6%
FEMALE POVERTY
93.0/ 100
METRIC RATING
110th/ 347
METRIC RANK
13.3%
FEMALE POVERTY
62.4/ 100
METRIC RATING
163rd/ 347
METRIC RANK
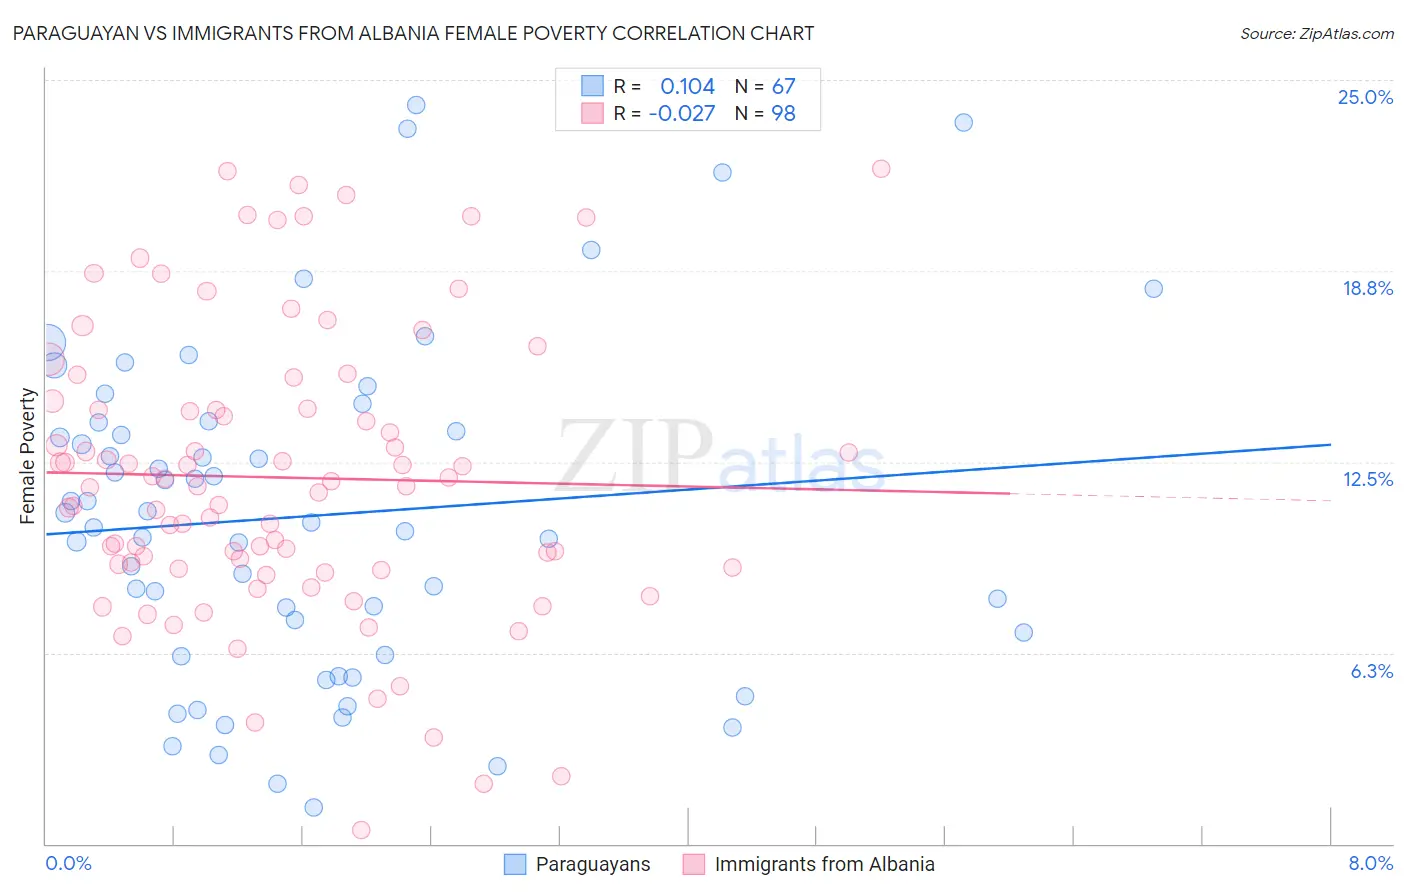
Paraguayan vs Immigrants from Albania Female Poverty Correlation Chart
The statistical analysis conducted on geographies consisting of 95,097,647 people shows a poor positive correlation between the proportion of Paraguayans and poverty level among females in the United States with a correlation coefficient (R) of 0.104 and weighted average of 12.6%. Similarly, the statistical analysis conducted on geographies consisting of 119,347,063 people shows no correlation between the proportion of Immigrants from Albania and poverty level among females in the United States with a correlation coefficient (R) of -0.027 and weighted average of 13.3%, a difference of 5.3%.
Female Poverty Correlation Summary
| Measurement | Paraguayan | Immigrants from Albania |
| Minimum | 1.2% | 0.46% |
| Maximum | 24.2% | 22.1% |
| Range | 23.0% | 21.6% |
| Mean | 10.7% | 12.0% |
| Median | 10.5% | 11.7% |
| Interquartile 25% (IQ1) | 6.2% | 9.0% |
| Interquartile 75% (IQ3) | 13.8% | 14.3% |
| Interquartile Range (IQR) | 7.6% | 5.2% |
| Standard Deviation (Sample) | 5.4% | 4.7% |
| Standard Deviation (Population) | 5.4% | 4.7% |
Similar Demographics by Female Poverty
Demographics Similar to Paraguayans by Female Poverty
In terms of female poverty, the demographic groups most similar to Paraguayans are Immigrants from Zimbabwe (12.6%, a difference of 0.030%), Portuguese (12.6%, a difference of 0.040%), Laotian (12.6%, a difference of 0.15%), Soviet Union (12.6%, a difference of 0.22%), and Immigrants from Turkey (12.6%, a difference of 0.33%).
| Demographics | Rating | Rank | Female Poverty |
| Slavs | 94.5 /100 | #103 | Exceptional 12.5% |
| Palestinians | 94.3 /100 | #104 | Exceptional 12.5% |
| Scottish | 94.1 /100 | #105 | Exceptional 12.5% |
| Immigrants | Turkey | 93.8 /100 | #106 | Exceptional 12.6% |
| Laotians | 93.4 /100 | #107 | Exceptional 12.6% |
| Portuguese | 93.1 /100 | #108 | Exceptional 12.6% |
| Immigrants | Zimbabwe | 93.1 /100 | #109 | Exceptional 12.6% |
| Paraguayans | 93.0 /100 | #110 | Exceptional 12.6% |
| Soviet Union | 92.4 /100 | #111 | Exceptional 12.6% |
| Immigrants | Israel | 92.0 /100 | #112 | Exceptional 12.6% |
| Canadians | 92.0 /100 | #113 | Exceptional 12.7% |
| Welsh | 91.6 /100 | #114 | Exceptional 12.7% |
| Puget Sound Salish | 91.5 /100 | #115 | Exceptional 12.7% |
| Immigrants | Russia | 91.2 /100 | #116 | Exceptional 12.7% |
| Immigrants | Southern Europe | 90.9 /100 | #117 | Exceptional 12.7% |
Demographics Similar to Immigrants from Albania by Female Poverty
In terms of female poverty, the demographic groups most similar to Immigrants from Albania are Guamanian/Chamorro (13.3%, a difference of 0.0%), Immigrants from Ethiopia (13.3%, a difference of 0.010%), Ethiopian (13.3%, a difference of 0.010%), Scotch-Irish (13.3%, a difference of 0.030%), and Immigrants from Nepal (13.3%, a difference of 0.040%).
| Demographics | Rating | Rank | Female Poverty |
| Immigrants | Bosnia and Herzegovina | 69.7 /100 | #156 | Good 13.2% |
| Immigrants | Northern Africa | 68.8 /100 | #157 | Good 13.2% |
| Pennsylvania Germans | 67.3 /100 | #158 | Good 13.2% |
| Costa Ricans | 63.6 /100 | #159 | Good 13.3% |
| Immigrants | Nepal | 62.7 /100 | #160 | Good 13.3% |
| Immigrants | Ethiopia | 62.5 /100 | #161 | Good 13.3% |
| Guamanians/Chamorros | 62.4 /100 | #162 | Good 13.3% |
| Immigrants | Albania | 62.4 /100 | #163 | Good 13.3% |
| Ethiopians | 62.3 /100 | #164 | Good 13.3% |
| Scotch-Irish | 62.1 /100 | #165 | Good 13.3% |
| Immigrants | Oceania | 59.7 /100 | #166 | Average 13.3% |
| Immigrants | Chile | 57.4 /100 | #167 | Average 13.3% |
| Aleuts | 56.7 /100 | #168 | Average 13.4% |
| Lebanese | 55.9 /100 | #169 | Average 13.4% |
| Colombians | 55.7 /100 | #170 | Average 13.4% |