Paraguayan vs Immigrants from Malaysia 4th Grade

COMPARE

Paraguayan
Race
Ancestry
AfghanAfricanAlaska NativeAlaskan AthabascanAlbanianAleutAlsatianAmericanApacheArabArapahoArgentineanArmenianAssyrian/Chaldean/SyriacAustralianAustrianBahamianBangladeshiBarbadianBasqueBelgianBelizeanBermudanBhutaneseBlackfeetBolivianBrazilianBritishBritish West IndianBulgarianBurmeseCajunCambodianCanadianCape VerdeanCarpatho RusynCelticCentral AmericanCentral American IndianCherokeeCheyenneChickasawChileanChineseChippewaChoctawColombianColvilleComancheCosta RicanCreeCreekCroatianCrowCubanCypriotCzechCzechoslovakianDanishDelawareDominicanDutchDutch West IndianEastern EuropeanEcuadorianEgyptianEnglishEstonianEthiopianEuropeanFijianFilipinoFinnishFrenchFrench American IndianFrench CanadianGermanGerman RussianGhanaianGreekGuamanian/ChamorroGuatemalanGuyaneseHaitianHmongHonduranHopiHoumaHungarianIcelanderIndian (Asian)IndonesianInupiatIranianIraqiIrishIroquoisIsraeliItalianJamaicanJapaneseJordanianKenyanKiowaKoreanLaotianLatvianLebaneseLiberianLithuanianLumbeeLuxembourgerMacedonianMalaysianMalteseMarshalleseMenomineeMexicanMexican American IndianMongolianMoroccanNative HawaiianNavajoNepaleseNew ZealanderNicaraguanNigerianNorthern EuropeanNorwegianOkinawanOsageOttawaPaiutePakistaniPalestinianPanamanianParaguayanPennsylvania GermanPeruvianPimaPolishPortuguesePotawatomiPuebloPuerto RicanPuget Sound SalishRomanianRussianSalvadoranSamoanScandinavianScotch-IrishScottishSeminoleSenegaleseSerbianShoshoneSierra LeoneanSiouxSlavicSlovakSloveneSomaliSouth AfricanSouth AmericanSouth American IndianSoviet UnionSpaniardSpanishSpanish AmericanSpanish American IndianSri LankanSubsaharan AfricanSudaneseSwedishSwissSyrianTaiwaneseThaiTlingit-HaidaTohono O'OdhamTonganTrinidadian and TobagonianTsimshianTurkishU.S. Virgin IslanderUgandanUkrainianUruguayanUteVenezuelanVietnameseWelshWest IndianYakamaYaquiYugoslavianYumanYup'ikZimbabwean
Immigration
NonimmigrantsImmigrantsAfghanistanAfricaAlbaniaArgentinaArmeniaAsiaAustraliaAustriaBahamasBangladeshBarbadosBelarusBelgiumBelizeBoliviaBosnia and HerzegovinaBrazilBulgariaBurma/MyanmarCabo VerdeCambodiaCameroonCanadaCaribbeanCentral AmericaChileChinaColombiaCongoCosta RicaCroatiaCubaCzechoslovakiaDenmarkDominicaDominican RepublicEastern AfricaEastern AsiaEastern EuropeEcuadorEgyptEl SalvadorEnglandEritreaEthiopiaEuropeFijiFranceGermanyGhanaGreeceGrenadaGuatemalaGuyanaHaitiHondurasHong KongHungaryIndiaIndonesiaIranIraqIrelandIsraelItalyJamaicaJapanJordanKazakhstanKenyaKoreaKuwaitLaosLatin AmericaLatviaLebanonLiberiaLithuaniaMexicoMicronesiaMiddle AfricaMoldovaMoroccoNepalNetherlandsNicaraguaNigeriaNorth AmericaNorth MacedoniaNorthern AfricaNorthern EuropeNorwayOceaniaPakistanPanamaPeruPhilippinesPolandPortugalRomaniaRussiaSaudi ArabiaScotlandSenegalSerbiaSierra LeoneSingaporeSomaliaSouth AfricaSouth AmericaSouth Central AsiaSouth Eastern AsiaSouthern EuropeSpainSri LankaSt. Vincent and the GrenadinesSudanSwedenSwitzerlandSyriaTaiwanThailandTrinidad and TobagoTurkeyUgandaUkraineUruguayUzbekistanVenezuelaVietnamWest IndiesWestern AfricaWestern AsiaWestern EuropeYemenZaireZimbabweAzores
Immigrants from Malaysia
Race
Ancestry
AfghanAfricanAlaska NativeAlaskan AthabascanAlbanianAleutAlsatianAmericanApacheArabArapahoArgentineanArmenianAssyrian/Chaldean/SyriacAustralianAustrianBahamianBangladeshiBarbadianBasqueBelgianBelizeanBermudanBhutaneseBlackfeetBolivianBrazilianBritishBritish West IndianBulgarianBurmeseCajunCambodianCanadianCape VerdeanCarpatho RusynCelticCentral AmericanCentral American IndianCherokeeCheyenneChickasawChileanChineseChippewaChoctawColombianColvilleComancheCosta RicanCreeCreekCroatianCrowCubanCypriotCzechCzechoslovakianDanishDelawareDominicanDutchDutch West IndianEastern EuropeanEcuadorianEgyptianEnglishEstonianEthiopianEuropeanFijianFilipinoFinnishFrenchFrench American IndianFrench CanadianGermanGerman RussianGhanaianGreekGuamanian/ChamorroGuatemalanGuyaneseHaitianHmongHonduranHopiHoumaHungarianIcelanderIndian (Asian)IndonesianInupiatIranianIraqiIrishIroquoisIsraeliItalianJamaicanJapaneseJordanianKenyanKiowaKoreanLaotianLatvianLebaneseLiberianLithuanianLumbeeLuxembourgerMacedonianMalaysianMalteseMarshalleseMenomineeMexicanMexican American IndianMongolianMoroccanNative HawaiianNavajoNepaleseNew ZealanderNicaraguanNigerianNorthern EuropeanNorwegianOkinawanOsageOttawaPaiutePakistaniPalestinianPanamanianPennsylvania GermanPeruvianPimaPolishPortuguesePotawatomiPuebloPuerto RicanPuget Sound SalishRomanianRussianSalvadoranSamoanScandinavianScotch-IrishScottishSeminoleSenegaleseSerbianShoshoneSierra LeoneanSiouxSlavicSlovakSloveneSomaliSouth AfricanSouth AmericanSouth American IndianSoviet UnionSpaniardSpanishSpanish AmericanSpanish American IndianSri LankanSubsaharan AfricanSudaneseSwedishSwissSyrianTaiwaneseThaiTlingit-HaidaTohono O'OdhamTonganTrinidadian and TobagonianTsimshianTurkishU.S. Virgin IslanderUgandanUkrainianUruguayanUteVenezuelanVietnameseWelshWest IndianYakamaYaquiYugoslavianYumanYup'ikZimbabwean
Immigration
NonimmigrantsImmigrantsAfghanistanAfricaAlbaniaArgentinaArmeniaAsiaAustraliaAustriaBahamasBangladeshBarbadosBelarusBelgiumBelizeBoliviaBosnia and HerzegovinaBrazilBulgariaBurma/MyanmarCabo VerdeCambodiaCameroonCanadaCaribbeanCentral AmericaChileChinaColombiaCongoCosta RicaCroatiaCubaCzechoslovakiaDenmarkDominicaDominican RepublicEastern AfricaEastern AsiaEastern EuropeEcuadorEgyptEl SalvadorEnglandEritreaEthiopiaEuropeFijiFranceGermanyGhanaGreeceGrenadaGuatemalaGuyanaHaitiHondurasHong KongHungaryIndiaIndonesiaIranIraqIrelandIsraelItalyJamaicaJapanJordanKazakhstanKenyaKoreaKuwaitLaosLatin AmericaLatviaLebanonLiberiaLithuaniaMalaysiaMexicoMicronesiaMiddle AfricaMoldovaMoroccoNepalNetherlandsNicaraguaNigeriaNorth AmericaNorth MacedoniaNorthern AfricaNorthern EuropeNorwayOceaniaPakistanPanamaPeruPhilippinesPolandPortugalRomaniaRussiaSaudi ArabiaScotlandSenegalSerbiaSierra LeoneSingaporeSomaliaSouth AfricaSouth AmericaSouth Central AsiaSouth Eastern AsiaSouthern EuropeSpainSri LankaSt. Vincent and the GrenadinesSudanSwedenSwitzerlandSyriaTaiwanThailandTrinidad and TobagoTurkeyUgandaUkraineUruguayUzbekistanVenezuelaVietnamWest IndiesWestern AfricaWestern AsiaWestern EuropeYemenZaireZimbabweAzores
4th Grade
Income
Poverty
Unemployment
Labor Participation
Family Structure
Vehicle Availability
Education Level
Disability

4th Grade Comparison

Paraguayans

Immigrants from Malaysia

Fair
Tragic
97.4%
4TH GRADE
28.9/ 100
METRIC RATING
195th/ 347
METRIC RANK
97.2%
4TH GRADE
3.4/ 100
METRIC RATING
231st/ 347
METRIC RANK

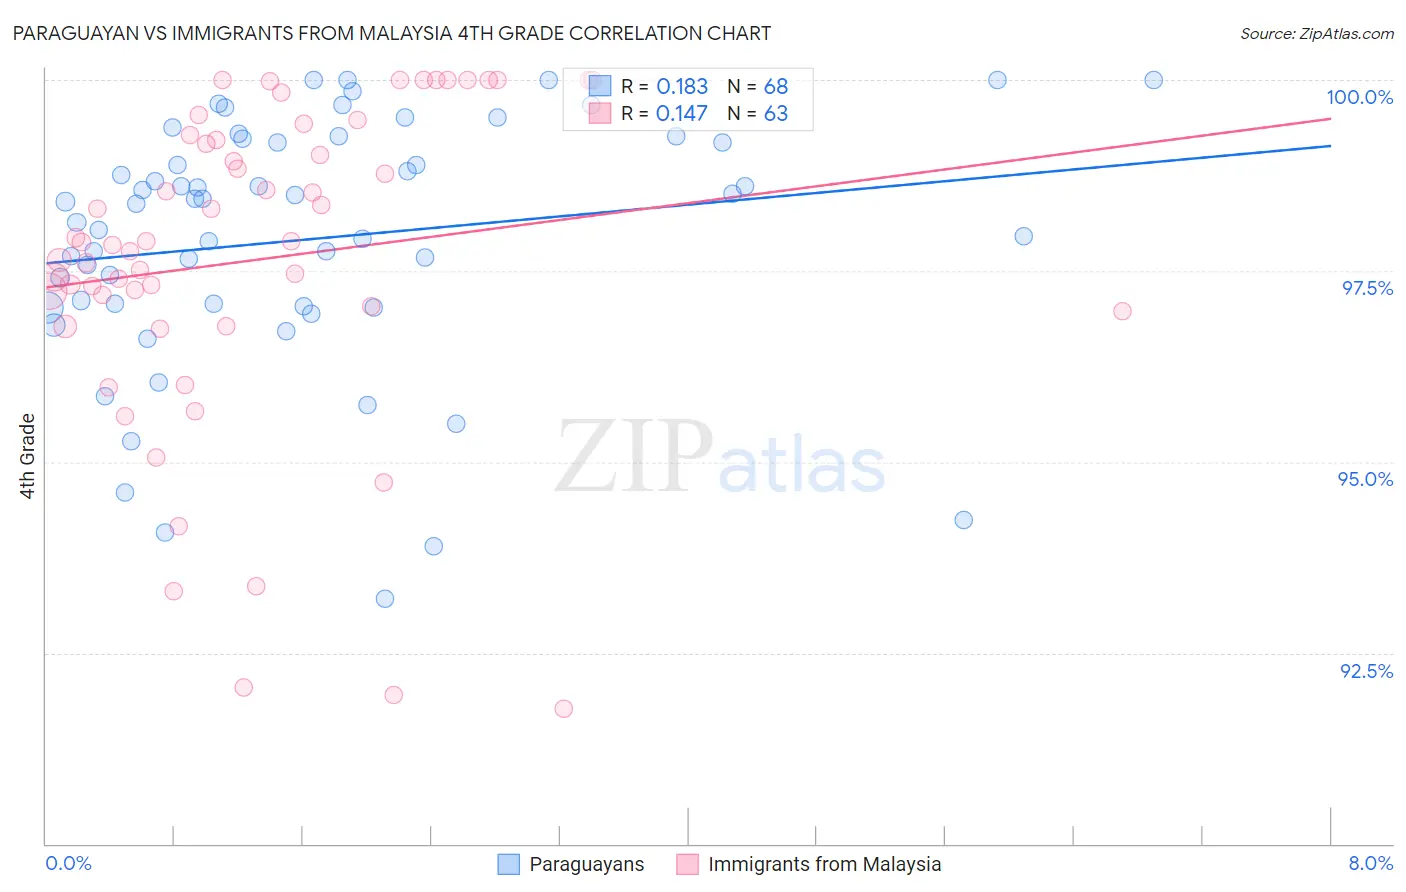
Paraguayan vs Immigrants from Malaysia 4th Grade Correlation Chart

The statistical analysis conducted on geographies consisting of 95,115,093 people shows a poor positive correlation between the proportion of Paraguayans and percentage of population with at least 4th grade education in the United States with a correlation coefficient (R) of 0.183 and weighted average of 97.4%. Similarly, the statistical analysis conducted on geographies consisting of 197,973,709 people shows a poor positive correlation between the proportion of Immigrants from Malaysia and percentage of population with at least 4th grade education in the United States with a correlation coefficient (R) of 0.147 and weighted average of 97.2%, a difference of 0.23%.
Paraguayan vs Immigrants from Malaysia 4th Grade

4th Grade Correlation Summary

MeasurementParaguayanImmigrants from Malaysia
Minimum93.2%91.8%
Maximum100.0%100.0%
Range6.8%8.2%
Mean97.9%97.6%
Median98.4%97.9%
Interquartile 25% (IQ1)97.0%97.0%
Interquartile 75% (IQ3)99.2%99.3%
Interquartile Range (IQR)2.2%2.3%
Standard Deviation (Sample)1.6%2.1%
Standard Deviation (Population)1.6%2.1%

Similar Demographics by 4th Grade

Demographics Similar to Paraguayans by 4th Grade

In terms of 4th grade, the demographic groups most similar to Paraguayans are Portuguese (97.4%, a difference of 0.0%), Panamanian (97.4%, a difference of 0.010%), Black/African American (97.4%, a difference of 0.010%), Navajo (97.4%, a difference of 0.010%), and Immigrants from Ukraine (97.4%, a difference of 0.010%).
DemographicsRating | Rank4th Grade
Immigrants | Argentina
34.6
/100
|
#188
Fair
97.5%
Panamanians
31.9
/100
|
#189
Fair
97.4%
Blacks/African Americans
31.1
/100
|
#190
Fair
97.4%
Navajo
30.7
/100
|
#191
Fair
97.4%
Immigrants | Ukraine
30.1
/100
|
#192
Fair
97.4%
Immigrants | Egypt
30.1
/100
|
#193
Fair
97.4%
Portuguese
29.2
/100
|
#194
Fair
97.4%
Paraguayans
28.9
/100
|
#195
Fair
97.4%
Immigrants | Albania
27.7
/100
|
#196
Fair
97.4%
Hawaiians
25.6
/100
|
#197
Fair
97.4%
Guamanians/Chamorros
23.0
/100
|
#198
Fair
97.4%
Natives/Alaskans
20.6
/100
|
#199
Fair
97.4%
Immigrants | Uganda
19.8
/100
|
#200
Poor
97.4%
Immigrants | Southern Europe
16.2
/100
|
#201
Poor
97.4%
Immigrants | Chile
16.1
/100
|
#202
Poor
97.4%

Demographics Similar to Immigrants from Malaysia by 4th Grade

In terms of 4th grade, the demographic groups most similar to Immigrants from Malaysia are Uruguayan (97.2%, a difference of 0.0%), Immigrants from Western Asia (97.2%, a difference of 0.0%), Bahamian (97.2%, a difference of 0.010%), Immigrants from Pakistan (97.2%, a difference of 0.010%), and Subsaharan African (97.2%, a difference of 0.010%).
DemographicsRating | Rank4th Grade
Immigrants | Syria
5.0
/100
|
#224
Tragic
97.2%
Immigrants | Iraq
4.6
/100
|
#225
Tragic
97.2%
Bahamians
3.8
/100
|
#226
Tragic
97.2%
Immigrants | Pakistan
3.7
/100
|
#227
Tragic
97.2%
Sub-Saharan Africans
3.6
/100
|
#228
Tragic
97.2%
Liberians
3.6
/100
|
#229
Tragic
97.2%
Uruguayans
3.5
/100
|
#230
Tragic
97.2%
Immigrants | Malaysia
3.4
/100
|
#231
Tragic
97.2%
Immigrants | Western Asia
3.4
/100
|
#232
Tragic
97.2%
Senegalese
3.1
/100
|
#233
Tragic
97.2%
Assyrians/Chaldeans/Syriacs
3.0
/100
|
#234
Tragic
97.2%
Yuman
2.9
/100
|
#235
Tragic
97.2%
Immigrants | Eastern Asia
2.7
/100
|
#236
Tragic
97.2%
Immigrants | Costa Rica
2.0
/100
|
#237
Tragic
97.2%
Indians (Asian)
1.9
/100
|
#238
Tragic
97.2%