Panamanian vs Cajun Single Father Poverty
COMPARE
Panamanian
Cajun
Single Father Poverty
Single Father Poverty Comparison
Panamanians
Cajuns
16.4%
SINGLE FATHER POVERTY
33.6/ 100
METRIC RATING
185th/ 347
METRIC RANK
23.1%
SINGLE FATHER POVERTY
0.0/ 100
METRIC RATING
336th/ 347
METRIC RANK
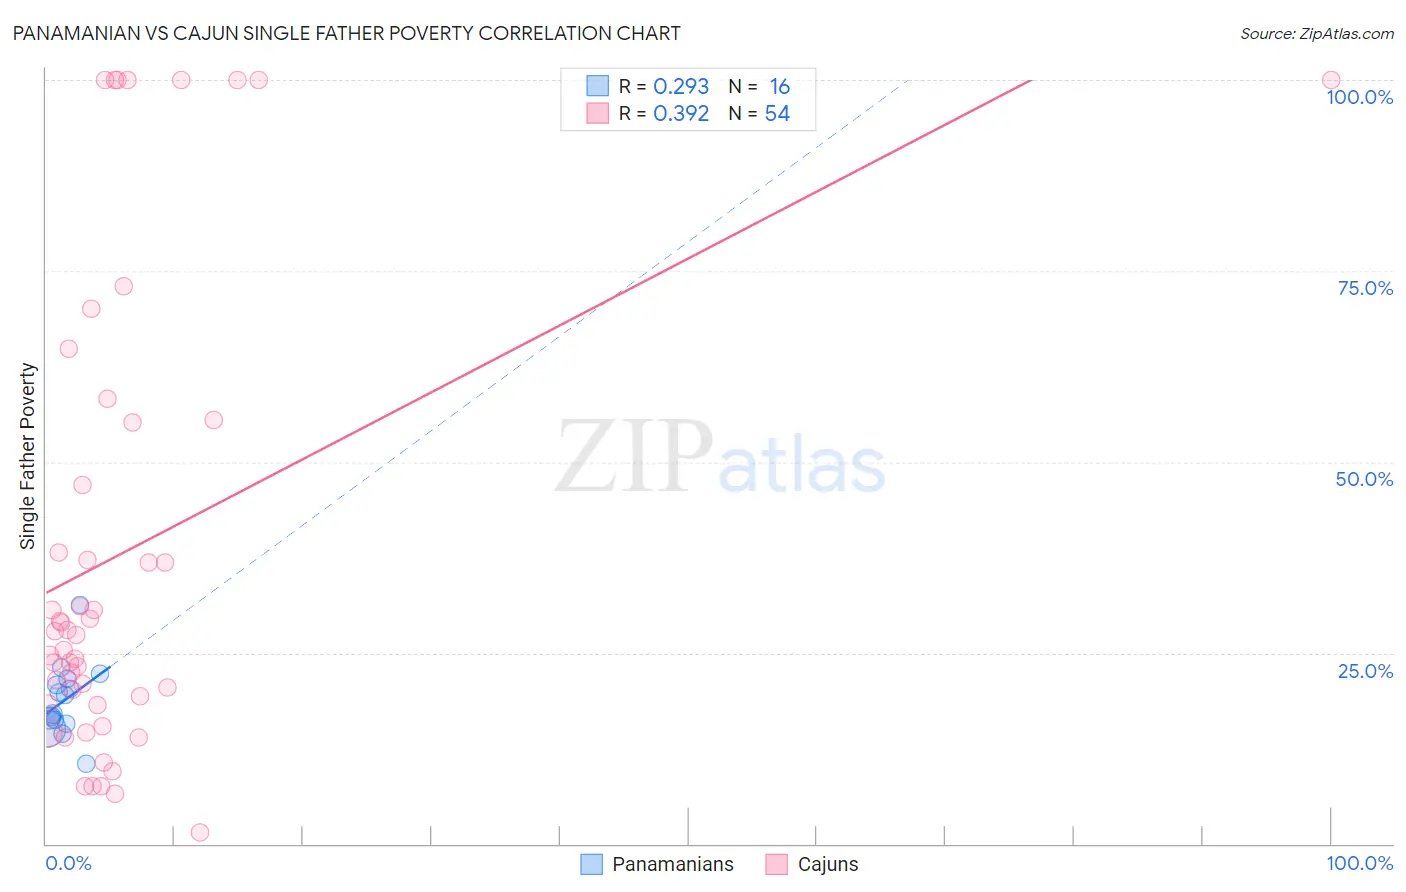
Panamanian vs Cajun Single Father Poverty Correlation Chart
The statistical analysis conducted on geographies consisting of 236,933,167 people shows a weak positive correlation between the proportion of Panamanians and poverty level among single fathers in the United States with a correlation coefficient (R) of 0.293 and weighted average of 16.4%. Similarly, the statistical analysis conducted on geographies consisting of 130,032,102 people shows a mild positive correlation between the proportion of Cajuns and poverty level among single fathers in the United States with a correlation coefficient (R) of 0.392 and weighted average of 23.1%, a difference of 40.6%.
Single Father Poverty Correlation Summary
| Measurement | Panamanian | Cajun |
| Minimum | 10.4% | 1.4% |
| Maximum | 31.2% | 100.0% |
| Range | 20.8% | 98.6% |
| Mean | 18.8% | 38.2% |
| Median | 18.2% | 27.6% |
| Interquartile 25% (IQ1) | 15.9% | 18.4% |
| Interquartile 75% (IQ3) | 21.2% | 55.1% |
| Interquartile Range (IQR) | 5.3% | 36.7% |
| Standard Deviation (Sample) | 4.7% | 30.3% |
| Standard Deviation (Population) | 4.6% | 30.0% |
Similar Demographics by Single Father Poverty
Demographics Similar to Panamanians by Single Father Poverty
In terms of single father poverty, the demographic groups most similar to Panamanians are Cambodian (16.4%, a difference of 0.050%), Aleut (16.4%, a difference of 0.080%), Immigrants from Italy (16.4%, a difference of 0.11%), Immigrants from Western Africa (16.4%, a difference of 0.12%), and Immigrants from Venezuela (16.4%, a difference of 0.13%).
| Demographics | Rating | Rank | Single Father Poverty |
| Immigrants | Cuba | 41.6 /100 | #178 | Average 16.4% |
| Serbians | 40.9 /100 | #179 | Average 16.4% |
| Immigrants | Latin America | 37.2 /100 | #180 | Fair 16.4% |
| Immigrants | Western Africa | 36.0 /100 | #181 | Fair 16.4% |
| Immigrants | Italy | 35.7 /100 | #182 | Fair 16.4% |
| Aleuts | 35.3 /100 | #183 | Fair 16.4% |
| Cambodians | 34.6 /100 | #184 | Fair 16.4% |
| Panamanians | 33.6 /100 | #185 | Fair 16.4% |
| Immigrants | Venezuela | 31.0 /100 | #186 | Fair 16.4% |
| Ukrainians | 30.4 /100 | #187 | Fair 16.4% |
| Russians | 30.1 /100 | #188 | Fair 16.4% |
| Latvians | 28.9 /100 | #189 | Fair 16.5% |
| Immigrants | Burma/Myanmar | 28.0 /100 | #190 | Fair 16.5% |
| Immigrants | Guyana | 27.1 /100 | #191 | Fair 16.5% |
| Immigrants | Switzerland | 24.8 /100 | #192 | Fair 16.5% |
Demographics Similar to Cajuns by Single Father Poverty
In terms of single father poverty, the demographic groups most similar to Cajuns are Shoshone (22.9%, a difference of 0.71%), Kiowa (22.5%, a difference of 2.7%), Native/Alaskan (22.4%, a difference of 3.0%), Sioux (23.9%, a difference of 3.5%), and Arapaho (24.0%, a difference of 3.9%).
| Demographics | Rating | Rank | Single Father Poverty |
| Colville | 0.0 /100 | #329 | Tragic 21.4% |
| Paiute | 0.0 /100 | #330 | Tragic 21.6% |
| Central American Indians | 0.0 /100 | #331 | Tragic 21.7% |
| Tohono O'odham | 0.0 /100 | #332 | Tragic 22.0% |
| Natives/Alaskans | 0.0 /100 | #333 | Tragic 22.4% |
| Kiowa | 0.0 /100 | #334 | Tragic 22.5% |
| Shoshone | 0.0 /100 | #335 | Tragic 22.9% |
| Cajuns | 0.0 /100 | #336 | Tragic 23.1% |
| Sioux | 0.0 /100 | #337 | Tragic 23.9% |
| Arapaho | 0.0 /100 | #338 | Tragic 24.0% |
| Apache | 0.0 /100 | #339 | Tragic 24.2% |
| Houma | 0.0 /100 | #340 | Tragic 26.7% |
| Hopi | 0.0 /100 | #341 | Tragic 27.2% |
| Yuman | 0.0 /100 | #342 | Tragic 28.4% |
| Lumbee | 0.0 /100 | #343 | Tragic 28.5% |