Immigrants from South Africa vs Cajun Single Father Poverty
COMPARE
Immigrants from South Africa
Cajun
Single Father Poverty
Single Father Poverty Comparison
Immigrants from South Africa
Cajuns
16.3%
SINGLE FATHER POVERTY
44.2/ 100
METRIC RATING
177th/ 347
METRIC RANK
23.1%
SINGLE FATHER POVERTY
0.0/ 100
METRIC RATING
336th/ 347
METRIC RANK
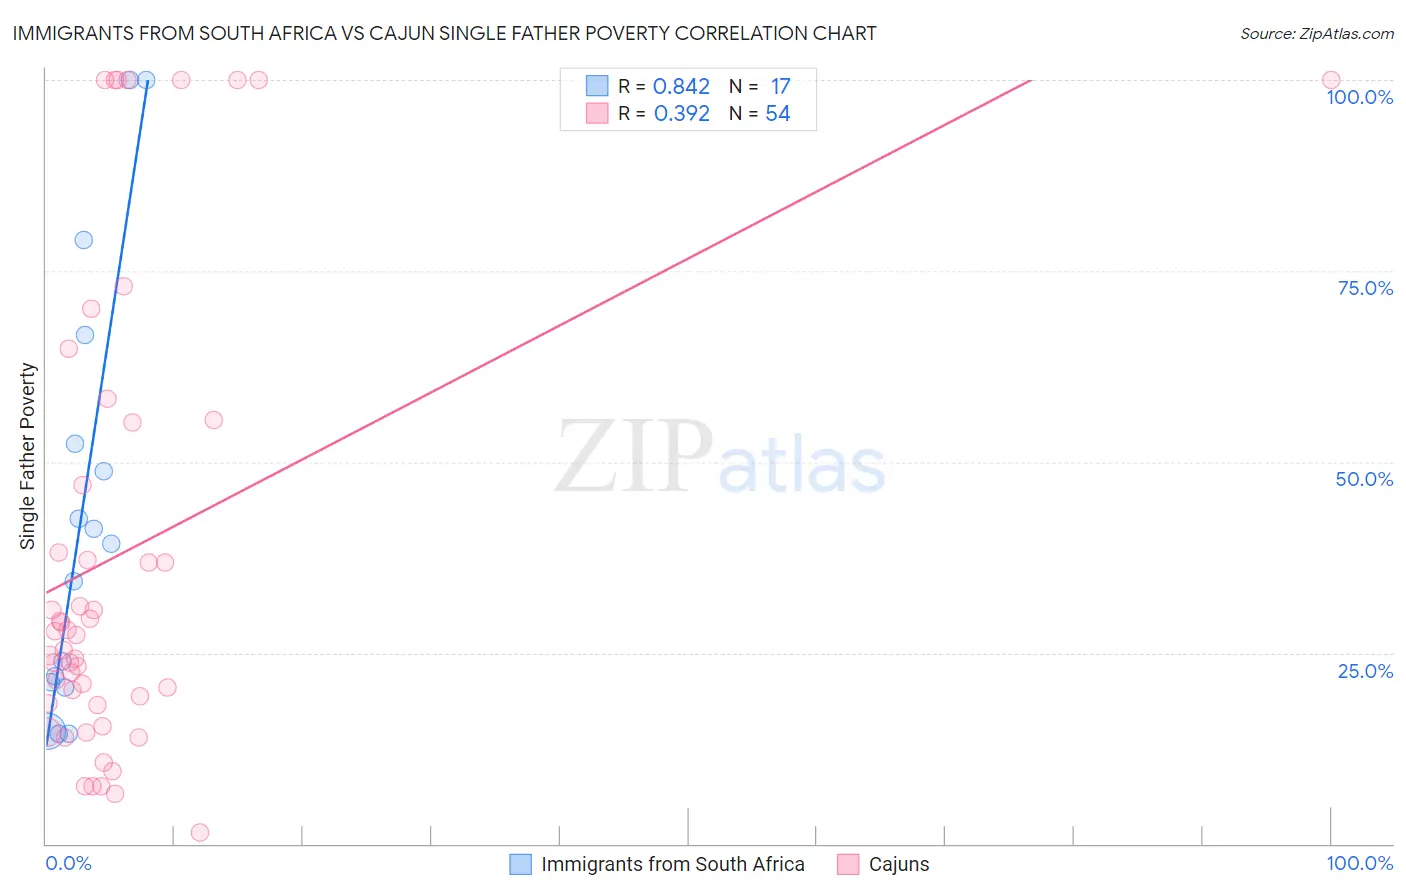
Immigrants from South Africa vs Cajun Single Father Poverty Correlation Chart
The statistical analysis conducted on geographies consisting of 189,025,953 people shows a very strong positive correlation between the proportion of Immigrants from South Africa and poverty level among single fathers in the United States with a correlation coefficient (R) of 0.842 and weighted average of 16.3%. Similarly, the statistical analysis conducted on geographies consisting of 130,032,102 people shows a mild positive correlation between the proportion of Cajuns and poverty level among single fathers in the United States with a correlation coefficient (R) of 0.392 and weighted average of 23.1%, a difference of 41.2%.
Single Father Poverty Correlation Summary
| Measurement | Immigrants from South Africa | Cajun |
| Minimum | 14.4% | 1.4% |
| Maximum | 100.0% | 100.0% |
| Range | 85.6% | 98.6% |
| Mean | 43.2% | 38.2% |
| Median | 39.3% | 27.6% |
| Interquartile 25% (IQ1) | 20.8% | 18.4% |
| Interquartile 75% (IQ3) | 59.5% | 55.1% |
| Interquartile Range (IQR) | 38.7% | 36.7% |
| Standard Deviation (Sample) | 28.3% | 30.3% |
| Standard Deviation (Population) | 27.4% | 30.0% |
Similar Demographics by Single Father Poverty
Demographics Similar to Immigrants from South Africa by Single Father Poverty
In terms of single father poverty, the demographic groups most similar to Immigrants from South Africa are Immigrants from Cuba (16.4%, a difference of 0.12%), Serbian (16.4%, a difference of 0.15%), Vietnamese (16.3%, a difference of 0.17%), Immigrants from Ecuador (16.3%, a difference of 0.24%), and Immigrants from Sierra Leone (16.3%, a difference of 0.26%).
| Demographics | Rating | Rank | Single Father Poverty |
| Scandinavians | 52.3 /100 | #170 | Average 16.3% |
| Immigrants | Morocco | 50.7 /100 | #171 | Average 16.3% |
| Immigrants | Sierra Leone | 50.1 /100 | #172 | Average 16.3% |
| Immigrants | St. Vincent and the Grenadines | 50.0 /100 | #173 | Average 16.3% |
| Swedes | 50.0 /100 | #174 | Average 16.3% |
| Immigrants | Ecuador | 49.7 /100 | #175 | Average 16.3% |
| Vietnamese | 48.0 /100 | #176 | Average 16.3% |
| Immigrants | South Africa | 44.2 /100 | #177 | Average 16.3% |
| Immigrants | Cuba | 41.6 /100 | #178 | Average 16.4% |
| Serbians | 40.9 /100 | #179 | Average 16.4% |
| Immigrants | Latin America | 37.2 /100 | #180 | Fair 16.4% |
| Immigrants | Western Africa | 36.0 /100 | #181 | Fair 16.4% |
| Immigrants | Italy | 35.7 /100 | #182 | Fair 16.4% |
| Aleuts | 35.3 /100 | #183 | Fair 16.4% |
| Cambodians | 34.6 /100 | #184 | Fair 16.4% |
Demographics Similar to Cajuns by Single Father Poverty
In terms of single father poverty, the demographic groups most similar to Cajuns are Shoshone (22.9%, a difference of 0.71%), Kiowa (22.5%, a difference of 2.7%), Native/Alaskan (22.4%, a difference of 3.0%), Sioux (23.9%, a difference of 3.5%), and Arapaho (24.0%, a difference of 3.9%).
| Demographics | Rating | Rank | Single Father Poverty |
| Colville | 0.0 /100 | #329 | Tragic 21.4% |
| Paiute | 0.0 /100 | #330 | Tragic 21.6% |
| Central American Indians | 0.0 /100 | #331 | Tragic 21.7% |
| Tohono O'odham | 0.0 /100 | #332 | Tragic 22.0% |
| Natives/Alaskans | 0.0 /100 | #333 | Tragic 22.4% |
| Kiowa | 0.0 /100 | #334 | Tragic 22.5% |
| Shoshone | 0.0 /100 | #335 | Tragic 22.9% |
| Cajuns | 0.0 /100 | #336 | Tragic 23.1% |
| Sioux | 0.0 /100 | #337 | Tragic 23.9% |
| Arapaho | 0.0 /100 | #338 | Tragic 24.0% |
| Apache | 0.0 /100 | #339 | Tragic 24.2% |
| Houma | 0.0 /100 | #340 | Tragic 26.7% |
| Hopi | 0.0 /100 | #341 | Tragic 27.2% |
| Yuman | 0.0 /100 | #342 | Tragic 28.4% |
| Lumbee | 0.0 /100 | #343 | Tragic 28.5% |