Jordanian vs Cajun Single Father Poverty
COMPARE
Jordanian
Cajun
Single Father Poverty
Single Father Poverty Comparison
Jordanians
Cajuns
16.1%
SINGLE FATHER POVERTY
74.2/ 100
METRIC RATING
150th/ 347
METRIC RANK
23.1%
SINGLE FATHER POVERTY
0.0/ 100
METRIC RATING
336th/ 347
METRIC RANK
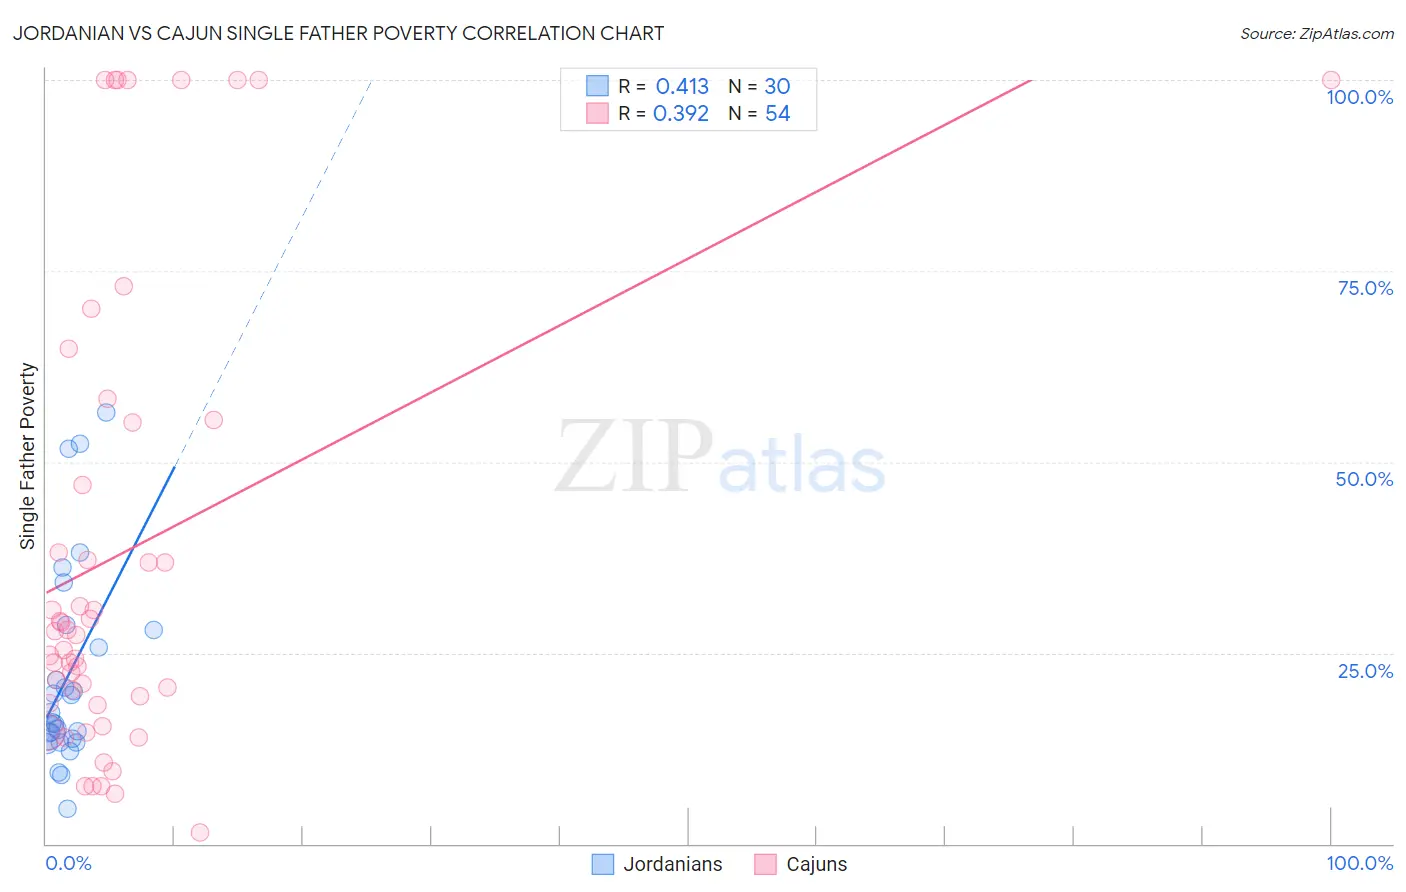
Jordanian vs Cajun Single Father Poverty Correlation Chart
The statistical analysis conducted on geographies consisting of 144,384,155 people shows a moderate positive correlation between the proportion of Jordanians and poverty level among single fathers in the United States with a correlation coefficient (R) of 0.413 and weighted average of 16.1%. Similarly, the statistical analysis conducted on geographies consisting of 130,032,102 people shows a mild positive correlation between the proportion of Cajuns and poverty level among single fathers in the United States with a correlation coefficient (R) of 0.392 and weighted average of 23.1%, a difference of 43.3%.
Single Father Poverty Correlation Summary
| Measurement | Jordanian | Cajun |
| Minimum | 4.6% | 1.4% |
| Maximum | 56.5% | 100.0% |
| Range | 51.9% | 98.6% |
| Mean | 22.1% | 38.2% |
| Median | 16.5% | 27.6% |
| Interquartile 25% (IQ1) | 13.8% | 18.4% |
| Interquartile 75% (IQ3) | 28.0% | 55.1% |
| Interquartile Range (IQR) | 14.2% | 36.7% |
| Standard Deviation (Sample) | 13.3% | 30.3% |
| Standard Deviation (Population) | 13.1% | 30.0% |
Similar Demographics by Single Father Poverty
Demographics Similar to Jordanians by Single Father Poverty
In terms of single father poverty, the demographic groups most similar to Jordanians are South African (16.1%, a difference of 0.060%), Immigrants from France (16.1%, a difference of 0.060%), Immigrants from Zimbabwe (16.1%, a difference of 0.12%), Immigrants from Israel (16.1%, a difference of 0.13%), and Nigerian (16.1%, a difference of 0.16%).
| Demographics | Rating | Rank | Single Father Poverty |
| Immigrants | Central America | 83.1 /100 | #143 | Excellent 16.0% |
| Immigrants | Kuwait | 81.4 /100 | #144 | Excellent 16.0% |
| Immigrants | Western Asia | 80.7 /100 | #145 | Excellent 16.0% |
| Immigrants | Hungary | 78.3 /100 | #146 | Good 16.1% |
| Colombians | 77.1 /100 | #147 | Good 16.1% |
| Nigerians | 76.8 /100 | #148 | Good 16.1% |
| South Africans | 75.1 /100 | #149 | Good 16.1% |
| Jordanians | 74.2 /100 | #150 | Good 16.1% |
| Immigrants | France | 73.1 /100 | #151 | Good 16.1% |
| Immigrants | Zimbabwe | 72.1 /100 | #152 | Good 16.1% |
| Immigrants | Israel | 72.0 /100 | #153 | Good 16.1% |
| Mexicans | 70.1 /100 | #154 | Good 16.1% |
| Immigrants | Nicaragua | 67.8 /100 | #155 | Good 16.2% |
| Immigrants | Jordan | 66.0 /100 | #156 | Good 16.2% |
| Immigrants | Czechoslovakia | 62.8 /100 | #157 | Good 16.2% |
Demographics Similar to Cajuns by Single Father Poverty
In terms of single father poverty, the demographic groups most similar to Cajuns are Shoshone (22.9%, a difference of 0.71%), Kiowa (22.5%, a difference of 2.7%), Native/Alaskan (22.4%, a difference of 3.0%), Sioux (23.9%, a difference of 3.5%), and Arapaho (24.0%, a difference of 3.9%).
| Demographics | Rating | Rank | Single Father Poverty |
| Colville | 0.0 /100 | #329 | Tragic 21.4% |
| Paiute | 0.0 /100 | #330 | Tragic 21.6% |
| Central American Indians | 0.0 /100 | #331 | Tragic 21.7% |
| Tohono O'odham | 0.0 /100 | #332 | Tragic 22.0% |
| Natives/Alaskans | 0.0 /100 | #333 | Tragic 22.4% |
| Kiowa | 0.0 /100 | #334 | Tragic 22.5% |
| Shoshone | 0.0 /100 | #335 | Tragic 22.9% |
| Cajuns | 0.0 /100 | #336 | Tragic 23.1% |
| Sioux | 0.0 /100 | #337 | Tragic 23.9% |
| Arapaho | 0.0 /100 | #338 | Tragic 24.0% |
| Apache | 0.0 /100 | #339 | Tragic 24.2% |
| Houma | 0.0 /100 | #340 | Tragic 26.7% |
| Hopi | 0.0 /100 | #341 | Tragic 27.2% |
| Yuman | 0.0 /100 | #342 | Tragic 28.4% |
| Lumbee | 0.0 /100 | #343 | Tragic 28.5% |