Immigrants from Laos vs Cajun Single Father Poverty
COMPARE
Immigrants from Laos
Cajun
Single Father Poverty
Single Father Poverty Comparison
Immigrants from Laos
Cajuns
15.1%
SINGLE FATHER POVERTY
99.9/ 100
METRIC RATING
56th/ 347
METRIC RANK
23.1%
SINGLE FATHER POVERTY
0.0/ 100
METRIC RATING
336th/ 347
METRIC RANK
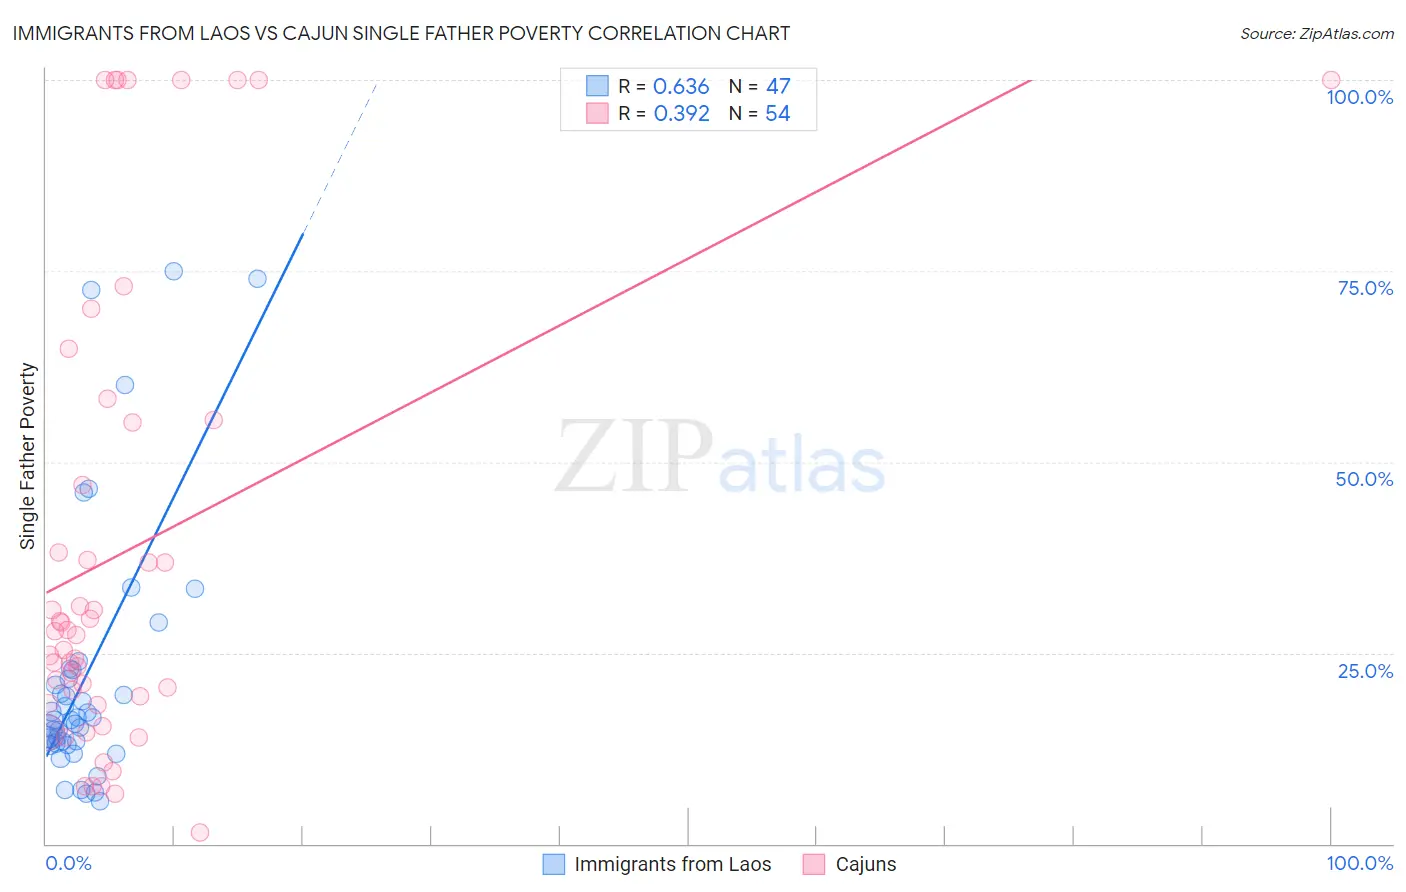
Immigrants from Laos vs Cajun Single Father Poverty Correlation Chart
The statistical analysis conducted on geographies consisting of 175,462,084 people shows a significant positive correlation between the proportion of Immigrants from Laos and poverty level among single fathers in the United States with a correlation coefficient (R) of 0.636 and weighted average of 15.1%. Similarly, the statistical analysis conducted on geographies consisting of 130,032,102 people shows a mild positive correlation between the proportion of Cajuns and poverty level among single fathers in the United States with a correlation coefficient (R) of 0.392 and weighted average of 23.1%, a difference of 53.2%.
Single Father Poverty Correlation Summary
| Measurement | Immigrants from Laos | Cajun |
| Minimum | 5.5% | 1.4% |
| Maximum | 75.0% | 100.0% |
| Range | 69.5% | 98.6% |
| Mean | 22.0% | 38.2% |
| Median | 16.2% | 27.6% |
| Interquartile 25% (IQ1) | 13.2% | 18.4% |
| Interquartile 75% (IQ3) | 22.7% | 55.1% |
| Interquartile Range (IQR) | 9.6% | 36.7% |
| Standard Deviation (Sample) | 17.3% | 30.3% |
| Standard Deviation (Population) | 17.1% | 30.0% |
Similar Demographics by Single Father Poverty
Demographics Similar to Immigrants from Laos by Single Father Poverty
In terms of single father poverty, the demographic groups most similar to Immigrants from Laos are Laotian (15.1%, a difference of 0.090%), Hawaiian (15.1%, a difference of 0.14%), Guamanian/Chamorro (15.1%, a difference of 0.24%), Immigrants from Bulgaria (15.0%, a difference of 0.28%), and Immigrants from Uzbekistan (15.0%, a difference of 0.32%).
| Demographics | Rating | Rank | Single Father Poverty |
| Immigrants | Eastern Asia | 99.9 /100 | #49 | Exceptional 15.0% |
| Bhutanese | 99.9 /100 | #50 | Exceptional 15.0% |
| Immigrants | Pakistan | 99.9 /100 | #51 | Exceptional 15.0% |
| Immigrants | El Salvador | 99.9 /100 | #52 | Exceptional 15.0% |
| Immigrants | Kenya | 99.9 /100 | #53 | Exceptional 15.0% |
| Immigrants | Uzbekistan | 99.9 /100 | #54 | Exceptional 15.0% |
| Immigrants | Bulgaria | 99.9 /100 | #55 | Exceptional 15.0% |
| Immigrants | Laos | 99.9 /100 | #56 | Exceptional 15.1% |
| Laotians | 99.9 /100 | #57 | Exceptional 15.1% |
| Hawaiians | 99.9 /100 | #58 | Exceptional 15.1% |
| Guamanians/Chamorros | 99.9 /100 | #59 | Exceptional 15.1% |
| Puget Sound Salish | 99.8 /100 | #60 | Exceptional 15.2% |
| Immigrants | Bosnia and Herzegovina | 99.8 /100 | #61 | Exceptional 15.2% |
| Immigrants | Armenia | 99.8 /100 | #62 | Exceptional 15.2% |
| Immigrants | Sweden | 99.8 /100 | #63 | Exceptional 15.2% |
Demographics Similar to Cajuns by Single Father Poverty
In terms of single father poverty, the demographic groups most similar to Cajuns are Shoshone (22.9%, a difference of 0.71%), Kiowa (22.5%, a difference of 2.7%), Native/Alaskan (22.4%, a difference of 3.0%), Sioux (23.9%, a difference of 3.5%), and Arapaho (24.0%, a difference of 3.9%).
| Demographics | Rating | Rank | Single Father Poverty |
| Colville | 0.0 /100 | #329 | Tragic 21.4% |
| Paiute | 0.0 /100 | #330 | Tragic 21.6% |
| Central American Indians | 0.0 /100 | #331 | Tragic 21.7% |
| Tohono O'odham | 0.0 /100 | #332 | Tragic 22.0% |
| Natives/Alaskans | 0.0 /100 | #333 | Tragic 22.4% |
| Kiowa | 0.0 /100 | #334 | Tragic 22.5% |
| Shoshone | 0.0 /100 | #335 | Tragic 22.9% |
| Cajuns | 0.0 /100 | #336 | Tragic 23.1% |
| Sioux | 0.0 /100 | #337 | Tragic 23.9% |
| Arapaho | 0.0 /100 | #338 | Tragic 24.0% |
| Apache | 0.0 /100 | #339 | Tragic 24.2% |
| Houma | 0.0 /100 | #340 | Tragic 26.7% |
| Hopi | 0.0 /100 | #341 | Tragic 27.2% |
| Yuman | 0.0 /100 | #342 | Tragic 28.4% |
| Lumbee | 0.0 /100 | #343 | Tragic 28.5% |