Panamanian vs Tongan Single Father Poverty
COMPARE
Panamanian
Tongan
Single Father Poverty
Single Father Poverty Comparison
Panamanians
Tongans
16.4%
SINGLE FATHER POVERTY
33.6/ 100
METRIC RATING
185th/ 347
METRIC RANK
12.2%
SINGLE FATHER POVERTY
100.0/ 100
METRIC RATING
2nd/ 347
METRIC RANK
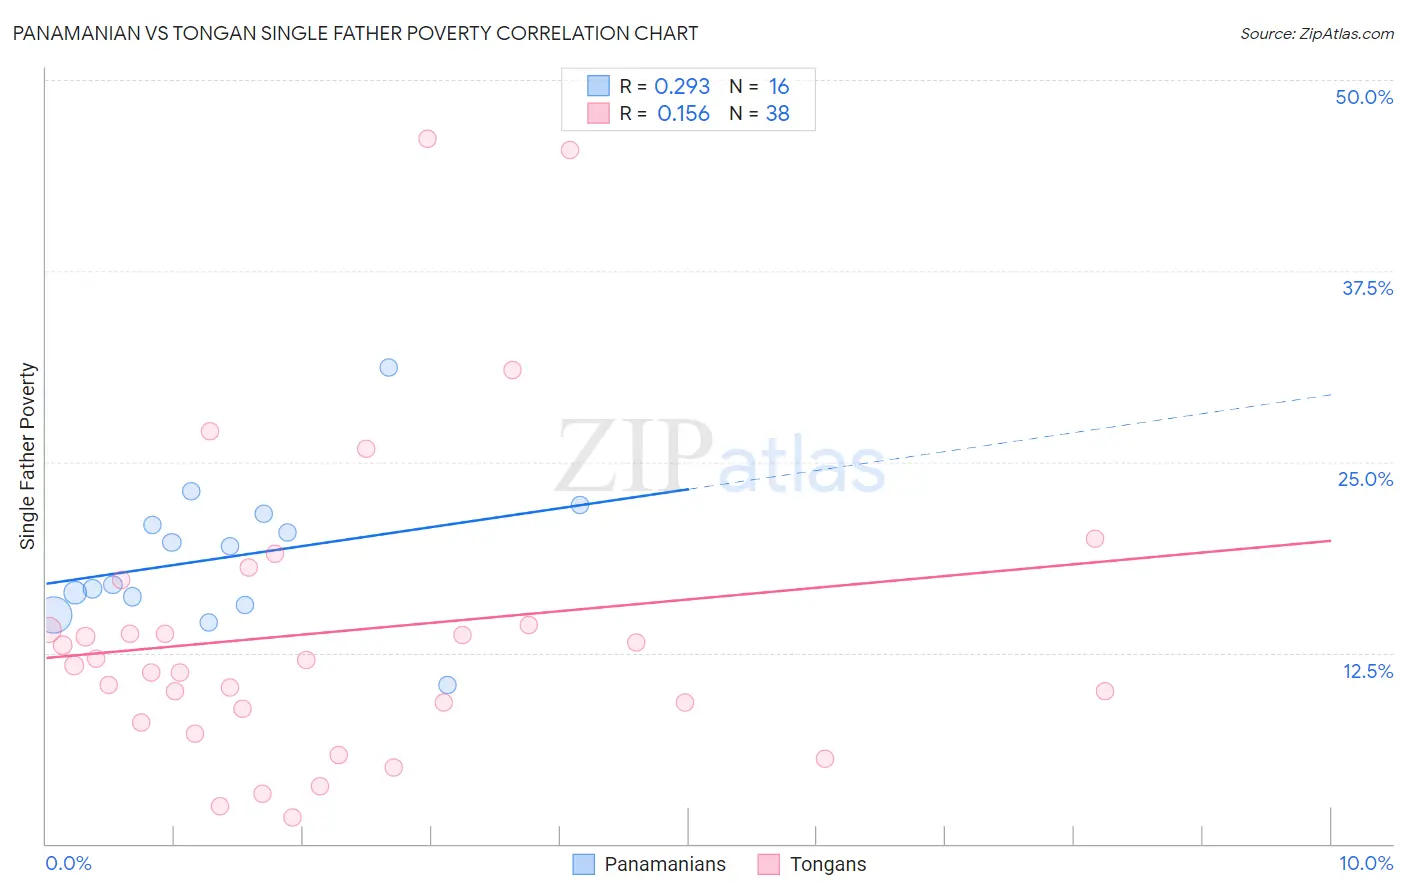
Panamanian vs Tongan Single Father Poverty Correlation Chart
The statistical analysis conducted on geographies consisting of 236,933,167 people shows a weak positive correlation between the proportion of Panamanians and poverty level among single fathers in the United States with a correlation coefficient (R) of 0.293 and weighted average of 16.4%. Similarly, the statistical analysis conducted on geographies consisting of 92,788,841 people shows a poor positive correlation between the proportion of Tongans and poverty level among single fathers in the United States with a correlation coefficient (R) of 0.156 and weighted average of 12.2%, a difference of 34.4%.
Single Father Poverty Correlation Summary
| Measurement | Panamanian | Tongan |
| Minimum | 10.4% | 1.7% |
| Maximum | 31.2% | 46.2% |
| Range | 20.8% | 44.4% |
| Mean | 18.8% | 13.9% |
| Median | 18.2% | 11.8% |
| Interquartile 25% (IQ1) | 15.9% | 8.8% |
| Interquartile 75% (IQ3) | 21.2% | 14.3% |
| Interquartile Range (IQR) | 5.3% | 5.5% |
| Standard Deviation (Sample) | 4.7% | 10.0% |
| Standard Deviation (Population) | 4.6% | 9.8% |
Similar Demographics by Single Father Poverty
Demographics Similar to Panamanians by Single Father Poverty
In terms of single father poverty, the demographic groups most similar to Panamanians are Cambodian (16.4%, a difference of 0.050%), Aleut (16.4%, a difference of 0.080%), Immigrants from Italy (16.4%, a difference of 0.11%), Immigrants from Western Africa (16.4%, a difference of 0.12%), and Immigrants from Venezuela (16.4%, a difference of 0.13%).
| Demographics | Rating | Rank | Single Father Poverty |
| Immigrants | Cuba | 41.6 /100 | #178 | Average 16.4% |
| Serbians | 40.9 /100 | #179 | Average 16.4% |
| Immigrants | Latin America | 37.2 /100 | #180 | Fair 16.4% |
| Immigrants | Western Africa | 36.0 /100 | #181 | Fair 16.4% |
| Immigrants | Italy | 35.7 /100 | #182 | Fair 16.4% |
| Aleuts | 35.3 /100 | #183 | Fair 16.4% |
| Cambodians | 34.6 /100 | #184 | Fair 16.4% |
| Panamanians | 33.6 /100 | #185 | Fair 16.4% |
| Immigrants | Venezuela | 31.0 /100 | #186 | Fair 16.4% |
| Ukrainians | 30.4 /100 | #187 | Fair 16.4% |
| Russians | 30.1 /100 | #188 | Fair 16.4% |
| Latvians | 28.9 /100 | #189 | Fair 16.5% |
| Immigrants | Burma/Myanmar | 28.0 /100 | #190 | Fair 16.5% |
| Immigrants | Guyana | 27.1 /100 | #191 | Fair 16.5% |
| Immigrants | Switzerland | 24.8 /100 | #192 | Fair 16.5% |
Demographics Similar to Tongans by Single Father Poverty
In terms of single father poverty, the demographic groups most similar to Tongans are Tsimshian (12.7%, a difference of 3.9%), Assyrian/Chaldean/Syriac (11.7%, a difference of 4.2%), Immigrants from Fiji (13.2%, a difference of 8.3%), Immigrants from Ethiopia (13.4%, a difference of 10.0%), and Ethiopian (13.5%, a difference of 10.9%).
| Demographics | Rating | Rank | Single Father Poverty |
| Assyrians/Chaldeans/Syriacs | 100.0 /100 | #1 | Exceptional 11.7% |
| Tongans | 100.0 /100 | #2 | Exceptional 12.2% |
| Tsimshian | 100.0 /100 | #3 | Exceptional 12.7% |
| Immigrants | Fiji | 100.0 /100 | #4 | Exceptional 13.2% |
| Immigrants | Ethiopia | 100.0 /100 | #5 | Exceptional 13.4% |
| Ethiopians | 100.0 /100 | #6 | Exceptional 13.5% |
| Immigrants | Taiwan | 100.0 /100 | #7 | Exceptional 13.7% |
| Samoans | 100.0 /100 | #8 | Exceptional 13.8% |
| Afghans | 100.0 /100 | #9 | Exceptional 14.0% |
| Koreans | 100.0 /100 | #10 | Exceptional 14.0% |
| Filipinos | 100.0 /100 | #11 | Exceptional 14.0% |
| Immigrants | India | 100.0 /100 | #12 | Exceptional 14.0% |
| Immigrants | Philippines | 100.0 /100 | #13 | Exceptional 14.0% |
| Immigrants | Vietnam | 100.0 /100 | #14 | Exceptional 14.1% |
| Sri Lankans | 100.0 /100 | #15 | Exceptional 14.2% |