Macedonian vs Cajun Single Father Poverty
COMPARE
Macedonian
Cajun
Single Father Poverty
Single Father Poverty Comparison
Macedonians
Cajuns
17.7%
SINGLE FATHER POVERTY
0.1/ 100
METRIC RATING
274th/ 347
METRIC RANK
23.1%
SINGLE FATHER POVERTY
0.0/ 100
METRIC RATING
336th/ 347
METRIC RANK
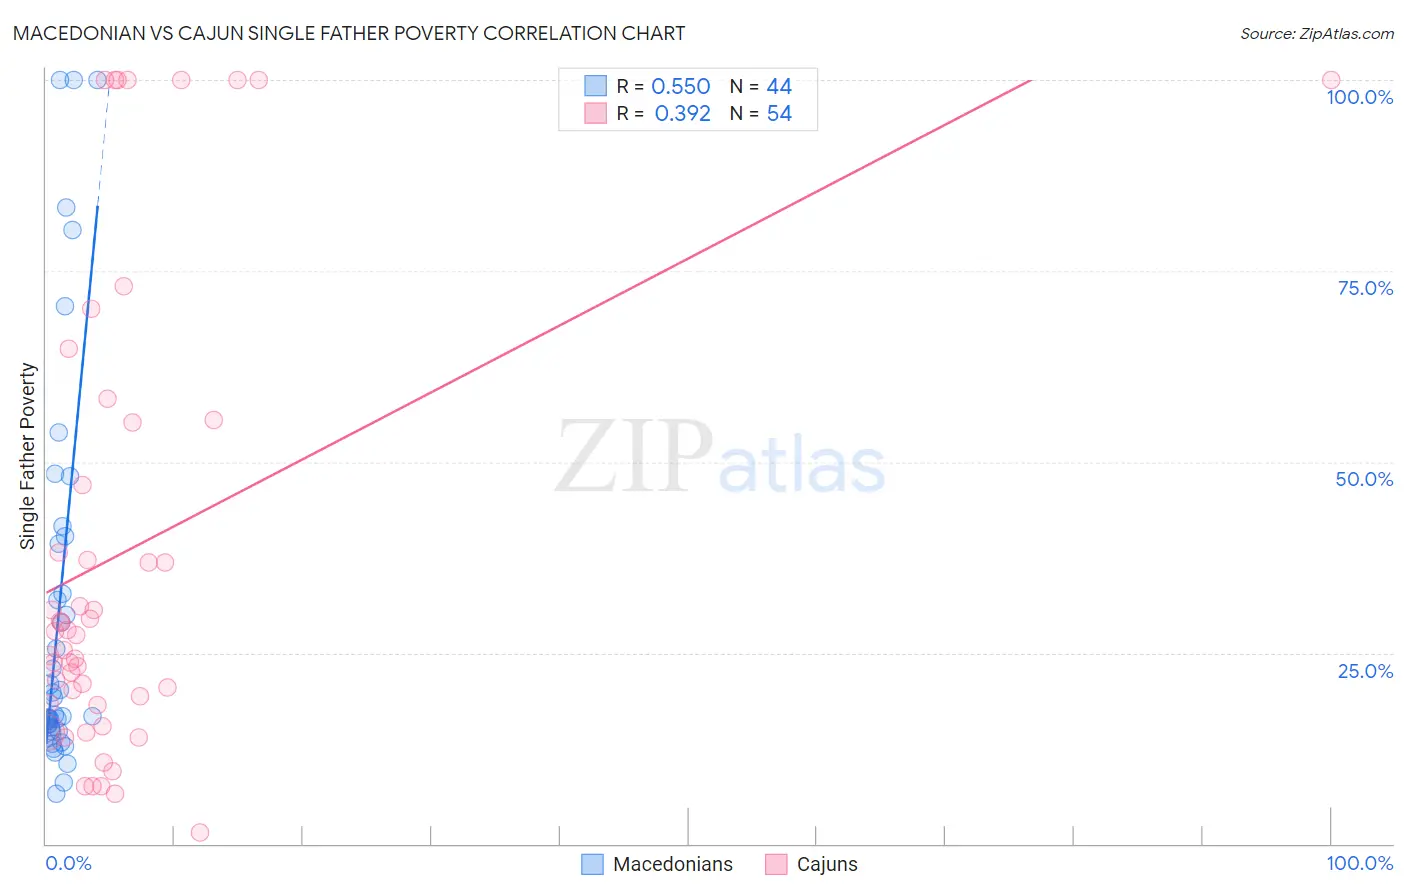
Macedonian vs Cajun Single Father Poverty Correlation Chart
The statistical analysis conducted on geographies consisting of 112,665,008 people shows a substantial positive correlation between the proportion of Macedonians and poverty level among single fathers in the United States with a correlation coefficient (R) of 0.550 and weighted average of 17.7%. Similarly, the statistical analysis conducted on geographies consisting of 130,032,102 people shows a mild positive correlation between the proportion of Cajuns and poverty level among single fathers in the United States with a correlation coefficient (R) of 0.392 and weighted average of 23.1%, a difference of 30.7%.
Single Father Poverty Correlation Summary
| Measurement | Macedonian | Cajun |
| Minimum | 6.6% | 1.4% |
| Maximum | 100.0% | 100.0% |
| Range | 93.4% | 98.6% |
| Mean | 31.1% | 38.2% |
| Median | 18.0% | 27.6% |
| Interquartile 25% (IQ1) | 15.0% | 18.4% |
| Interquartile 75% (IQ3) | 39.8% | 55.1% |
| Interquartile Range (IQR) | 24.8% | 36.7% |
| Standard Deviation (Sample) | 26.1% | 30.3% |
| Standard Deviation (Population) | 25.8% | 30.0% |
Similar Demographics by Single Father Poverty
Demographics Similar to Macedonians by Single Father Poverty
In terms of single father poverty, the demographic groups most similar to Macedonians are British West Indian (17.7%, a difference of 0.070%), German Russian (17.7%, a difference of 0.13%), Lebanese (17.7%, a difference of 0.28%), German (17.7%, a difference of 0.29%), and Iroquois (17.7%, a difference of 0.43%).
| Demographics | Rating | Rank | Single Father Poverty |
| Haitians | 0.3 /100 | #267 | Tragic 17.3% |
| Immigrants | Caribbean | 0.3 /100 | #268 | Tragic 17.4% |
| Slavs | 0.3 /100 | #269 | Tragic 17.4% |
| Indonesians | 0.2 /100 | #270 | Tragic 17.4% |
| French American Indians | 0.2 /100 | #271 | Tragic 17.4% |
| Barbadians | 0.1 /100 | #272 | Tragic 17.5% |
| Italians | 0.1 /100 | #273 | Tragic 17.5% |
| Macedonians | 0.1 /100 | #274 | Tragic 17.7% |
| British West Indians | 0.0 /100 | #275 | Tragic 17.7% |
| German Russians | 0.0 /100 | #276 | Tragic 17.7% |
| Lebanese | 0.0 /100 | #277 | Tragic 17.7% |
| Germans | 0.0 /100 | #278 | Tragic 17.7% |
| Iroquois | 0.0 /100 | #279 | Tragic 17.7% |
| Scottish | 0.0 /100 | #280 | Tragic 17.7% |
| English | 0.0 /100 | #281 | Tragic 17.8% |
Demographics Similar to Cajuns by Single Father Poverty
In terms of single father poverty, the demographic groups most similar to Cajuns are Shoshone (22.9%, a difference of 0.71%), Kiowa (22.5%, a difference of 2.7%), Native/Alaskan (22.4%, a difference of 3.0%), Sioux (23.9%, a difference of 3.5%), and Arapaho (24.0%, a difference of 3.9%).
| Demographics | Rating | Rank | Single Father Poverty |
| Colville | 0.0 /100 | #329 | Tragic 21.4% |
| Paiute | 0.0 /100 | #330 | Tragic 21.6% |
| Central American Indians | 0.0 /100 | #331 | Tragic 21.7% |
| Tohono O'odham | 0.0 /100 | #332 | Tragic 22.0% |
| Natives/Alaskans | 0.0 /100 | #333 | Tragic 22.4% |
| Kiowa | 0.0 /100 | #334 | Tragic 22.5% |
| Shoshone | 0.0 /100 | #335 | Tragic 22.9% |
| Cajuns | 0.0 /100 | #336 | Tragic 23.1% |
| Sioux | 0.0 /100 | #337 | Tragic 23.9% |
| Arapaho | 0.0 /100 | #338 | Tragic 24.0% |
| Apache | 0.0 /100 | #339 | Tragic 24.2% |
| Houma | 0.0 /100 | #340 | Tragic 26.7% |
| Hopi | 0.0 /100 | #341 | Tragic 27.2% |
| Yuman | 0.0 /100 | #342 | Tragic 28.4% |
| Lumbee | 0.0 /100 | #343 | Tragic 28.5% |