Panamanian vs Immigrants from Hong Kong Single Father Poverty
COMPARE
Panamanian
Immigrants from Hong Kong
Single Father Poverty
Single Father Poverty Comparison
Panamanians
Immigrants from Hong Kong
16.4%
SINGLE FATHER POVERTY
33.6/ 100
METRIC RATING
185th/ 347
METRIC RANK
14.2%
SINGLE FATHER POVERTY
100.0/ 100
METRIC RATING
17th/ 347
METRIC RANK
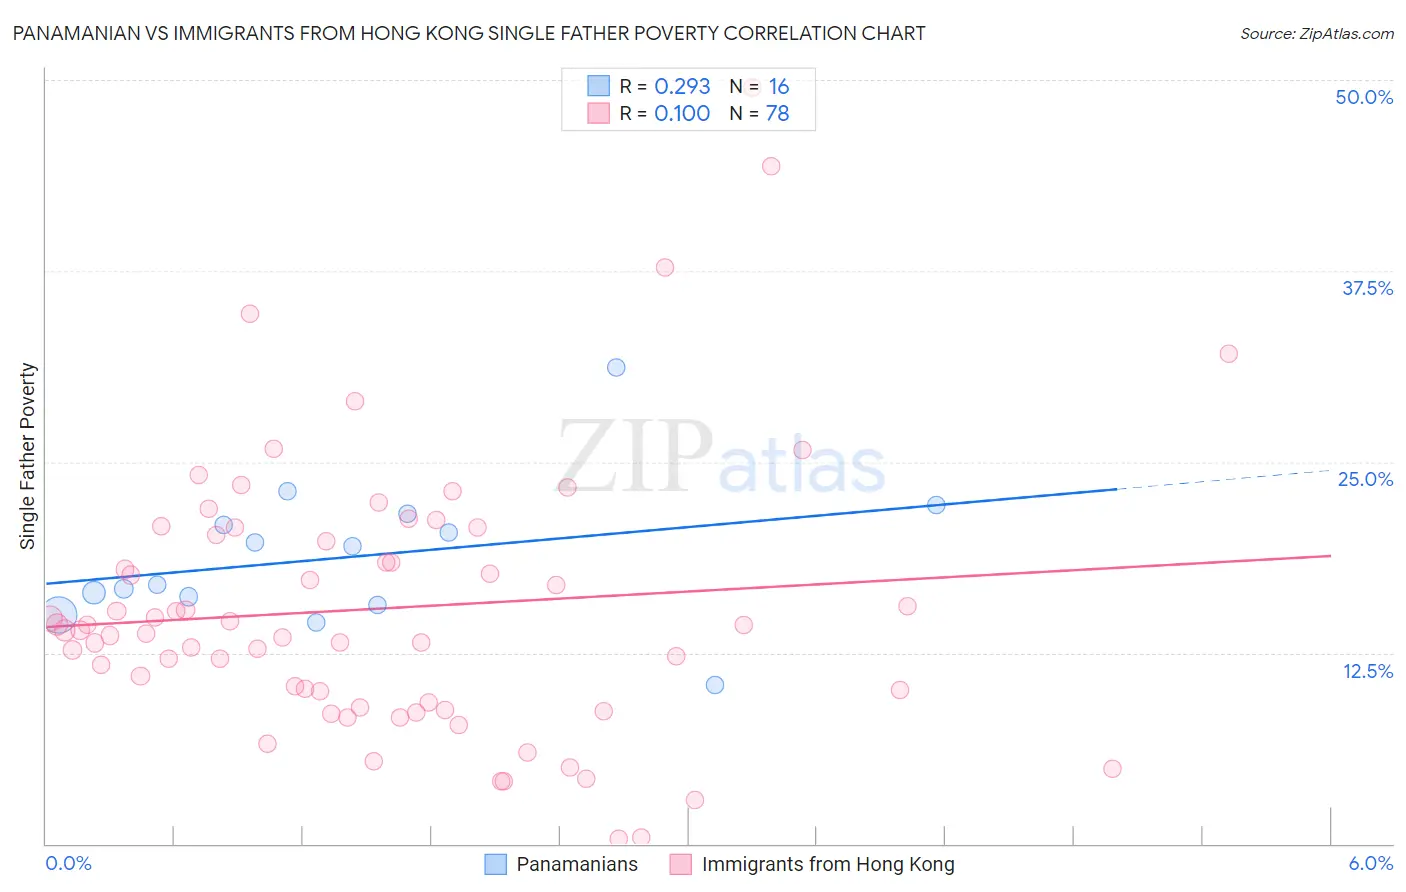
Panamanian vs Immigrants from Hong Kong Single Father Poverty Correlation Chart
The statistical analysis conducted on geographies consisting of 236,933,167 people shows a weak positive correlation between the proportion of Panamanians and poverty level among single fathers in the United States with a correlation coefficient (R) of 0.293 and weighted average of 16.4%. Similarly, the statistical analysis conducted on geographies consisting of 207,620,499 people shows a slight positive correlation between the proportion of Immigrants from Hong Kong and poverty level among single fathers in the United States with a correlation coefficient (R) of 0.100 and weighted average of 14.2%, a difference of 15.2%.
Single Father Poverty Correlation Summary
| Measurement | Panamanian | Immigrants from Hong Kong |
| Minimum | 10.4% | 0.30% |
| Maximum | 31.2% | 49.5% |
| Range | 20.8% | 49.2% |
| Mean | 18.8% | 15.4% |
| Median | 18.2% | 14.0% |
| Interquartile 25% (IQ1) | 15.9% | 9.2% |
| Interquartile 75% (IQ3) | 21.2% | 20.2% |
| Interquartile Range (IQR) | 5.3% | 11.0% |
| Standard Deviation (Sample) | 4.7% | 9.0% |
| Standard Deviation (Population) | 4.6% | 9.0% |
Similar Demographics by Single Father Poverty
Demographics Similar to Panamanians by Single Father Poverty
In terms of single father poverty, the demographic groups most similar to Panamanians are Cambodian (16.4%, a difference of 0.050%), Aleut (16.4%, a difference of 0.080%), Immigrants from Italy (16.4%, a difference of 0.11%), Immigrants from Western Africa (16.4%, a difference of 0.12%), and Immigrants from Venezuela (16.4%, a difference of 0.13%).
| Demographics | Rating | Rank | Single Father Poverty |
| Immigrants | Cuba | 41.6 /100 | #178 | Average 16.4% |
| Serbians | 40.9 /100 | #179 | Average 16.4% |
| Immigrants | Latin America | 37.2 /100 | #180 | Fair 16.4% |
| Immigrants | Western Africa | 36.0 /100 | #181 | Fair 16.4% |
| Immigrants | Italy | 35.7 /100 | #182 | Fair 16.4% |
| Aleuts | 35.3 /100 | #183 | Fair 16.4% |
| Cambodians | 34.6 /100 | #184 | Fair 16.4% |
| Panamanians | 33.6 /100 | #185 | Fair 16.4% |
| Immigrants | Venezuela | 31.0 /100 | #186 | Fair 16.4% |
| Ukrainians | 30.4 /100 | #187 | Fair 16.4% |
| Russians | 30.1 /100 | #188 | Fair 16.4% |
| Latvians | 28.9 /100 | #189 | Fair 16.5% |
| Immigrants | Burma/Myanmar | 28.0 /100 | #190 | Fair 16.5% |
| Immigrants | Guyana | 27.1 /100 | #191 | Fair 16.5% |
| Immigrants | Switzerland | 24.8 /100 | #192 | Fair 16.5% |
Demographics Similar to Immigrants from Hong Kong by Single Father Poverty
In terms of single father poverty, the demographic groups most similar to Immigrants from Hong Kong are Soviet Union (14.3%, a difference of 0.030%), Immigrants from Iraq (14.3%, a difference of 0.070%), Immigrants from Singapore (14.3%, a difference of 0.11%), Immigrants from Afghanistan (14.3%, a difference of 0.21%), and Immigrants from Iran (14.2%, a difference of 0.45%).
| Demographics | Rating | Rank | Single Father Poverty |
| Koreans | 100.0 /100 | #10 | Exceptional 14.0% |
| Filipinos | 100.0 /100 | #11 | Exceptional 14.0% |
| Immigrants | India | 100.0 /100 | #12 | Exceptional 14.0% |
| Immigrants | Philippines | 100.0 /100 | #13 | Exceptional 14.0% |
| Immigrants | Vietnam | 100.0 /100 | #14 | Exceptional 14.1% |
| Sri Lankans | 100.0 /100 | #15 | Exceptional 14.2% |
| Immigrants | Iran | 100.0 /100 | #16 | Exceptional 14.2% |
| Immigrants | Hong Kong | 100.0 /100 | #17 | Exceptional 14.2% |
| Soviet Union | 100.0 /100 | #18 | Exceptional 14.3% |
| Immigrants | Iraq | 100.0 /100 | #19 | Exceptional 14.3% |
| Immigrants | Singapore | 100.0 /100 | #20 | Exceptional 14.3% |
| Immigrants | Afghanistan | 100.0 /100 | #21 | Exceptional 14.3% |
| Taiwanese | 100.0 /100 | #22 | Exceptional 14.3% |
| Immigrants | Egypt | 100.0 /100 | #23 | Exceptional 14.4% |
| Immigrants | South Eastern Asia | 100.0 /100 | #24 | Exceptional 14.4% |