Panamanian vs Estonian Single Father Poverty
COMPARE
Panamanian
Estonian
Single Father Poverty
Single Father Poverty Comparison
Panamanians
Estonians
16.4%
SINGLE FATHER POVERTY
33.6/ 100
METRIC RATING
185th/ 347
METRIC RANK
16.2%
SINGLE FATHER POVERTY
56.7/ 100
METRIC RATING
161st/ 347
METRIC RANK
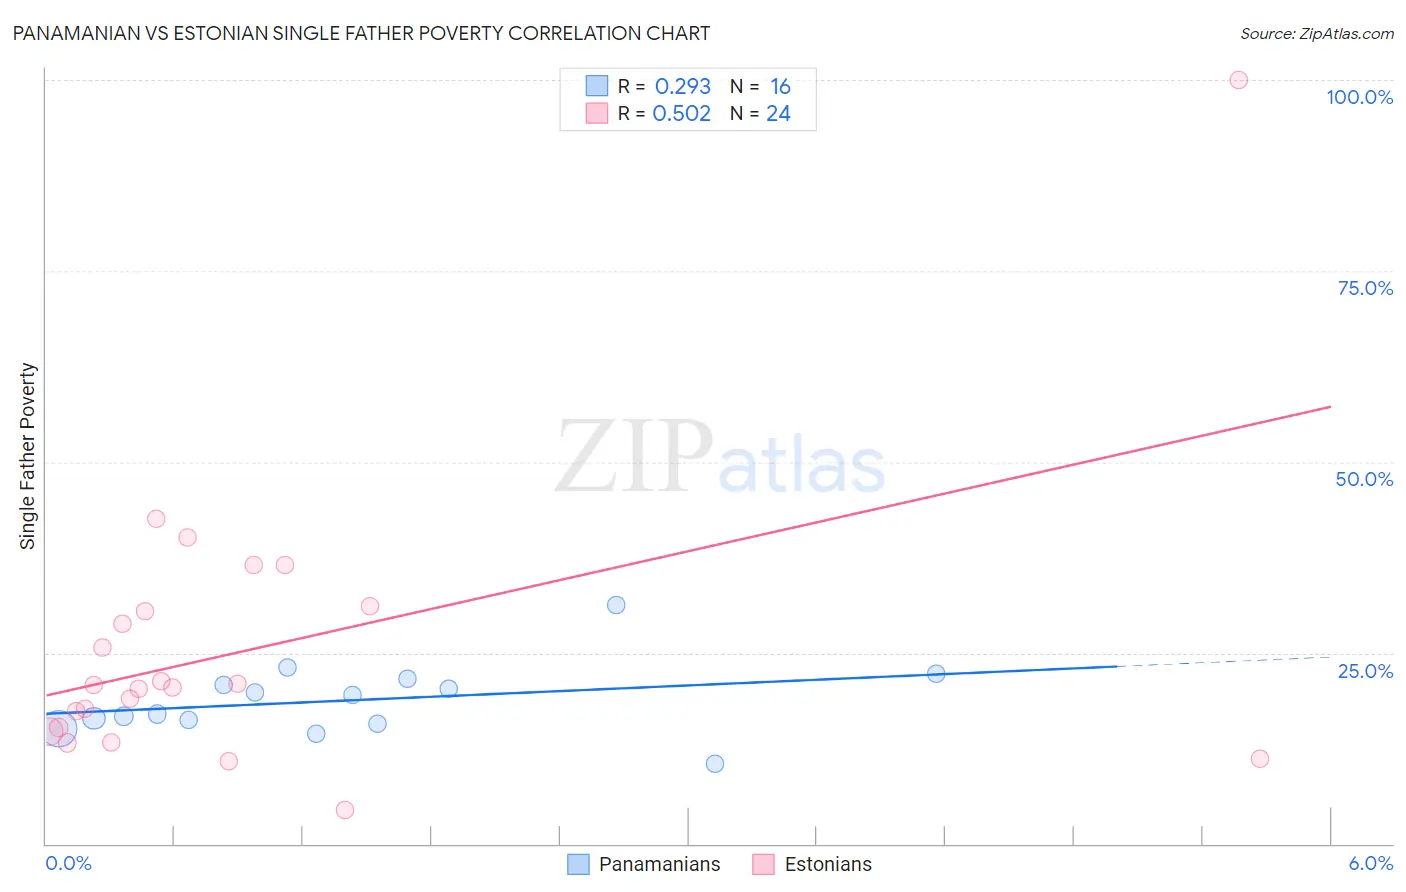
Panamanian vs Estonian Single Father Poverty Correlation Chart
The statistical analysis conducted on geographies consisting of 236,933,167 people shows a weak positive correlation between the proportion of Panamanians and poverty level among single fathers in the United States with a correlation coefficient (R) of 0.293 and weighted average of 16.4%. Similarly, the statistical analysis conducted on geographies consisting of 107,284,896 people shows a substantial positive correlation between the proportion of Estonians and poverty level among single fathers in the United States with a correlation coefficient (R) of 0.502 and weighted average of 16.2%, a difference of 1.1%.
Single Father Poverty Correlation Summary
| Measurement | Panamanian | Estonian |
| Minimum | 10.4% | 4.3% |
| Maximum | 31.2% | 100.0% |
| Range | 20.8% | 95.7% |
| Mean | 18.8% | 25.5% |
| Median | 18.2% | 20.6% |
| Interquartile 25% (IQ1) | 15.9% | 14.9% |
| Interquartile 75% (IQ3) | 21.2% | 30.7% |
| Interquartile Range (IQR) | 5.3% | 15.8% |
| Standard Deviation (Sample) | 4.7% | 18.7% |
| Standard Deviation (Population) | 4.6% | 18.3% |
Similar Demographics by Single Father Poverty
Demographics Similar to Panamanians by Single Father Poverty
In terms of single father poverty, the demographic groups most similar to Panamanians are Cambodian (16.4%, a difference of 0.050%), Aleut (16.4%, a difference of 0.080%), Immigrants from Italy (16.4%, a difference of 0.11%), Immigrants from Western Africa (16.4%, a difference of 0.12%), and Immigrants from Venezuela (16.4%, a difference of 0.13%).
| Demographics | Rating | Rank | Single Father Poverty |
| Immigrants | Cuba | 41.6 /100 | #178 | Average 16.4% |
| Serbians | 40.9 /100 | #179 | Average 16.4% |
| Immigrants | Latin America | 37.2 /100 | #180 | Fair 16.4% |
| Immigrants | Western Africa | 36.0 /100 | #181 | Fair 16.4% |
| Immigrants | Italy | 35.7 /100 | #182 | Fair 16.4% |
| Aleuts | 35.3 /100 | #183 | Fair 16.4% |
| Cambodians | 34.6 /100 | #184 | Fair 16.4% |
| Panamanians | 33.6 /100 | #185 | Fair 16.4% |
| Immigrants | Venezuela | 31.0 /100 | #186 | Fair 16.4% |
| Ukrainians | 30.4 /100 | #187 | Fair 16.4% |
| Russians | 30.1 /100 | #188 | Fair 16.4% |
| Latvians | 28.9 /100 | #189 | Fair 16.5% |
| Immigrants | Burma/Myanmar | 28.0 /100 | #190 | Fair 16.5% |
| Immigrants | Guyana | 27.1 /100 | #191 | Fair 16.5% |
| Immigrants | Switzerland | 24.8 /100 | #192 | Fair 16.5% |
Demographics Similar to Estonians by Single Father Poverty
In terms of single father poverty, the demographic groups most similar to Estonians are Ugandan (16.3%, a difference of 0.040%), Immigrants from Costa Rica (16.3%, a difference of 0.040%), Guyanese (16.3%, a difference of 0.070%), Immigrants from Bangladesh (16.3%, a difference of 0.070%), and Immigrants from Europe (16.3%, a difference of 0.080%).
| Demographics | Rating | Rank | Single Father Poverty |
| Mexicans | 70.1 /100 | #154 | Good 16.1% |
| Immigrants | Nicaragua | 67.8 /100 | #155 | Good 16.2% |
| Immigrants | Jordan | 66.0 /100 | #156 | Good 16.2% |
| Immigrants | Czechoslovakia | 62.8 /100 | #157 | Good 16.2% |
| Portuguese | 62.3 /100 | #158 | Good 16.2% |
| Belizeans | 59.9 /100 | #159 | Average 16.2% |
| Immigrants | Sudan | 59.8 /100 | #160 | Average 16.2% |
| Estonians | 56.7 /100 | #161 | Average 16.2% |
| Ugandans | 55.9 /100 | #162 | Average 16.3% |
| Immigrants | Costa Rica | 55.7 /100 | #163 | Average 16.3% |
| Guyanese | 55.2 /100 | #164 | Average 16.3% |
| Immigrants | Bangladesh | 55.1 /100 | #165 | Average 16.3% |
| Immigrants | Europe | 54.8 /100 | #166 | Average 16.3% |
| Yugoslavians | 53.9 /100 | #167 | Average 16.3% |
| Costa Ricans | 53.6 /100 | #168 | Average 16.3% |