Pakistani vs Immigrants from Ethiopia Median Family Income
COMPARE
Pakistani
Immigrants from Ethiopia
Median Family Income
Median Family Income Comparison
Pakistanis
Immigrants from Ethiopia
$107,390
MEDIAN FAMILY INCOME
91.7/ 100
METRIC RATING
124th/ 347
METRIC RANK
$106,969
MEDIAN FAMILY INCOME
90.0/ 100
METRIC RATING
128th/ 347
METRIC RANK
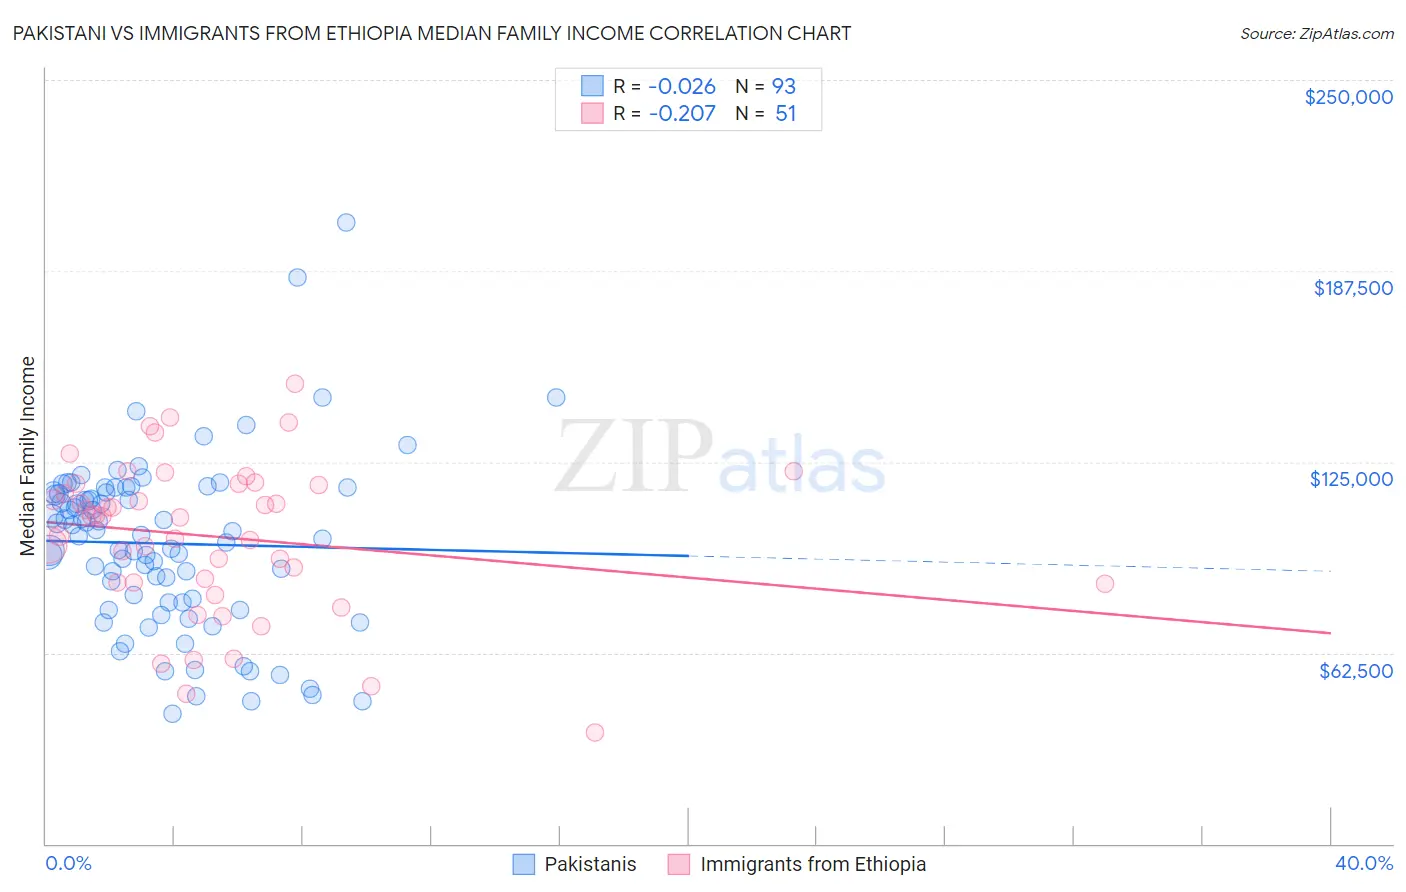
Pakistani vs Immigrants from Ethiopia Median Family Income Correlation Chart
The statistical analysis conducted on geographies consisting of 335,122,769 people shows no correlation between the proportion of Pakistanis and median family income in the United States with a correlation coefficient (R) of -0.026 and weighted average of $107,390. Similarly, the statistical analysis conducted on geographies consisting of 211,422,914 people shows a weak negative correlation between the proportion of Immigrants from Ethiopia and median family income in the United States with a correlation coefficient (R) of -0.207 and weighted average of $106,969, a difference of 0.39%.
Median Family Income Correlation Summary
| Measurement | Pakistani | Immigrants from Ethiopia |
| Minimum | $42,414 | $36,544 |
| Maximum | $203,281 | $150,528 |
| Range | $160,867 | $113,984 |
| Mean | $98,287 | $100,429 |
| Median | $101,250 | $107,133 |
| Interquartile 25% (IQ1) | $78,908 | $85,358 |
| Interquartile 75% (IQ3) | $114,990 | $117,899 |
| Interquartile Range (IQR) | $36,082 | $32,541 |
| Standard Deviation (Sample) | $28,141 | $24,958 |
| Standard Deviation (Population) | $27,989 | $24,712 |
Demographics Similar to Pakistanis and Immigrants from Ethiopia by Median Family Income
In terms of median family income, the demographic groups most similar to Pakistanis are Taiwanese ($107,295, a difference of 0.090%), Carpatho Rusyn ($107,502, a difference of 0.11%), Serbian ($107,157, a difference of 0.22%), Lebanese ($107,086, a difference of 0.28%), and Immigrants from Jordan ($107,715, a difference of 0.30%). Similarly, the demographic groups most similar to Immigrants from Ethiopia are Arab ($106,952, a difference of 0.020%), Brazilian ($106,942, a difference of 0.030%), Lebanese ($107,086, a difference of 0.11%), Serbian ($107,157, a difference of 0.18%), and Taiwanese ($107,295, a difference of 0.30%).
| Demographics | Rating | Rank | Median Family Income |
| Chileans | 95.0 /100 | #116 | Exceptional $108,429 |
| Immigrants | Philippines | 94.6 /100 | #117 | Exceptional $108,288 |
| Ethiopians | 94.5 /100 | #118 | Exceptional $108,251 |
| Sri Lankans | 94.5 /100 | #119 | Exceptional $108,234 |
| Immigrants | Northern Africa | 94.3 /100 | #120 | Exceptional $108,161 |
| Europeans | 94.1 /100 | #121 | Exceptional $108,099 |
| Immigrants | Jordan | 92.9 /100 | #122 | Exceptional $107,715 |
| Carpatho Rusyns | 92.2 /100 | #123 | Exceptional $107,502 |
| Pakistanis | 91.7 /100 | #124 | Exceptional $107,390 |
| Taiwanese | 91.4 /100 | #125 | Exceptional $107,295 |
| Serbians | 90.8 /100 | #126 | Exceptional $107,157 |
| Lebanese | 90.5 /100 | #127 | Exceptional $107,086 |
| Immigrants | Ethiopia | 90.0 /100 | #128 | Excellent $106,969 |
| Arabs | 89.9 /100 | #129 | Excellent $106,952 |
| Brazilians | 89.8 /100 | #130 | Excellent $106,942 |
| Canadians | 88.1 /100 | #131 | Excellent $106,597 |
| Immigrants | Fiji | 87.8 /100 | #132 | Excellent $106,544 |
| Ugandans | 87.8 /100 | #133 | Excellent $106,541 |
| Immigrants | Oceania | 87.3 /100 | #134 | Excellent $106,453 |
| Portuguese | 86.3 /100 | #135 | Excellent $106,286 |
| Immigrants | South Eastern Asia | 86.1 /100 | #136 | Excellent $106,252 |