Pakistani vs Immigrants from Ireland Female Poverty
COMPARE
Pakistani
Immigrants from Ireland
Female Poverty
Female Poverty Comparison
Pakistanis
Immigrants from Ireland
12.9%
FEMALE POVERTY
83.0/ 100
METRIC RATING
140th/ 347
METRIC RANK
11.0%
FEMALE POVERTY
99.9/ 100
METRIC RATING
6th/ 347
METRIC RANK
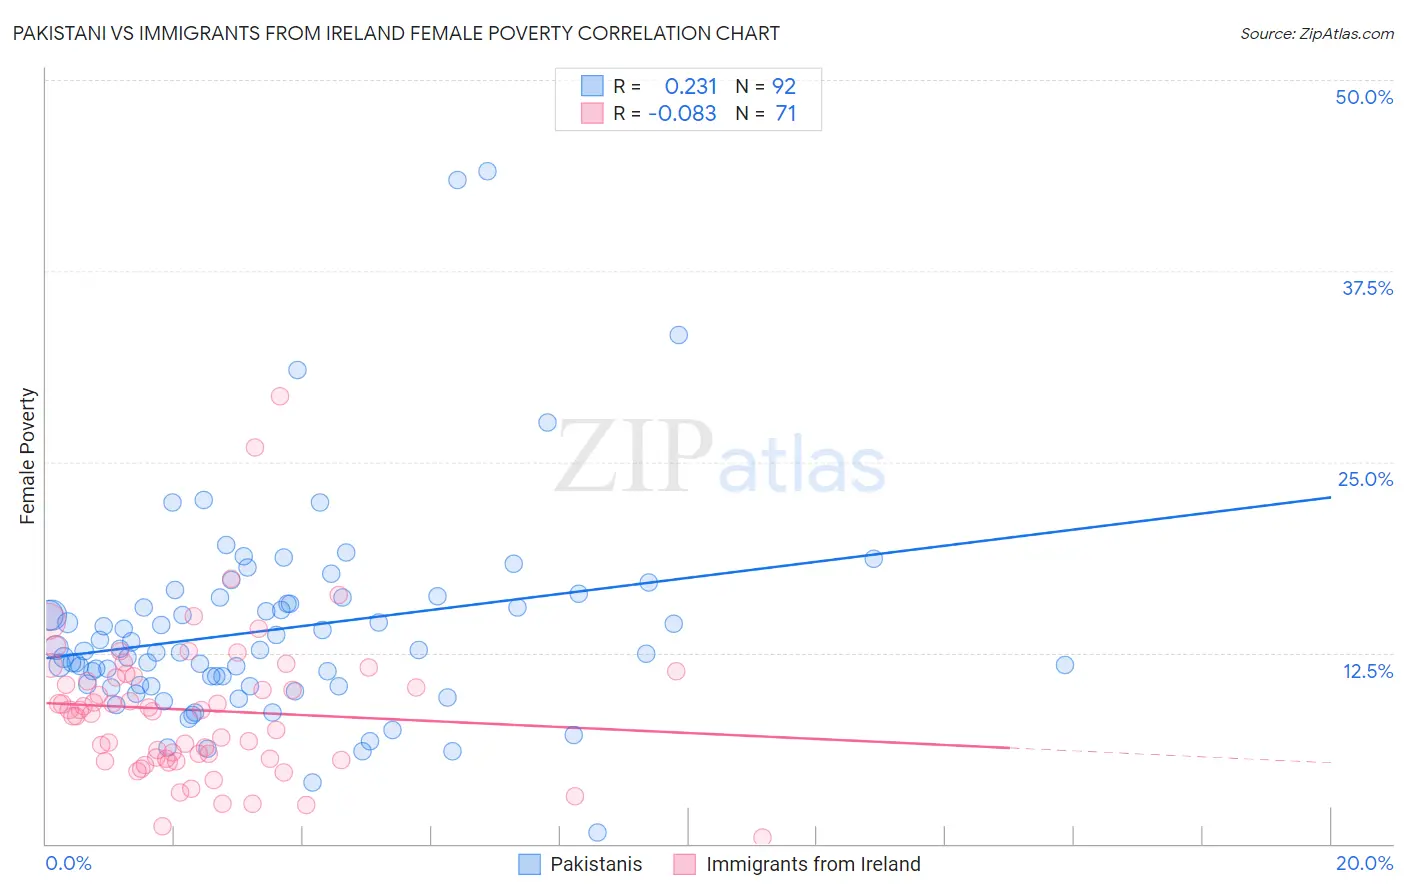
Pakistani vs Immigrants from Ireland Female Poverty Correlation Chart
The statistical analysis conducted on geographies consisting of 335,177,271 people shows a weak positive correlation between the proportion of Pakistanis and poverty level among females in the United States with a correlation coefficient (R) of 0.231 and weighted average of 12.9%. Similarly, the statistical analysis conducted on geographies consisting of 240,733,190 people shows a slight negative correlation between the proportion of Immigrants from Ireland and poverty level among females in the United States with a correlation coefficient (R) of -0.083 and weighted average of 11.0%, a difference of 17.6%.
Female Poverty Correlation Summary
| Measurement | Pakistani | Immigrants from Ireland |
| Minimum | 0.74% | 0.42% |
| Maximum | 44.1% | 29.3% |
| Range | 43.3% | 28.9% |
| Mean | 14.0% | 8.7% |
| Median | 12.7% | 8.8% |
| Interquartile 25% (IQ1) | 10.3% | 5.6% |
| Interquartile 75% (IQ3) | 15.9% | 10.9% |
| Interquartile Range (IQR) | 5.6% | 5.3% |
| Standard Deviation (Sample) | 6.8% | 4.8% |
| Standard Deviation (Population) | 6.7% | 4.8% |
Similar Demographics by Female Poverty
Demographics Similar to Pakistanis by Female Poverty
In terms of female poverty, the demographic groups most similar to Pakistanis are Basque (12.9%, a difference of 0.010%), Immigrants from France (12.9%, a difference of 0.10%), Chilean (12.9%, a difference of 0.32%), Icelander (13.0%, a difference of 0.32%), and Peruvian (12.9%, a difference of 0.41%).
| Demographics | Rating | Rank | Female Poverty |
| Immigrants | Western Europe | 86.6 /100 | #133 | Excellent 12.8% |
| Immigrants | Switzerland | 85.8 /100 | #134 | Excellent 12.9% |
| French | 85.6 /100 | #135 | Excellent 12.9% |
| Peruvians | 85.2 /100 | #136 | Excellent 12.9% |
| Chileans | 84.7 /100 | #137 | Excellent 12.9% |
| Immigrants | France | 83.6 /100 | #138 | Excellent 12.9% |
| Basques | 83.1 /100 | #139 | Excellent 12.9% |
| Pakistanis | 83.0 /100 | #140 | Excellent 12.9% |
| Icelanders | 81.1 /100 | #141 | Excellent 13.0% |
| Brazilians | 80.5 /100 | #142 | Excellent 13.0% |
| Immigrants | Malaysia | 80.4 /100 | #143 | Excellent 13.0% |
| Afghans | 79.8 /100 | #144 | Good 13.0% |
| Syrians | 79.6 /100 | #145 | Good 13.0% |
| Immigrants | Peru | 79.1 /100 | #146 | Good 13.0% |
| Immigrants | Kazakhstan | 78.6 /100 | #147 | Good 13.0% |
Demographics Similar to Immigrants from Ireland by Female Poverty
In terms of female poverty, the demographic groups most similar to Immigrants from Ireland are Assyrian/Chaldean/Syriac (11.0%, a difference of 0.37%), Filipino (10.9%, a difference of 0.38%), Immigrants from South Central Asia (11.1%, a difference of 1.1%), Bulgarian (11.1%, a difference of 1.3%), and Immigrants from Hong Kong (11.2%, a difference of 2.1%).
| Demographics | Rating | Rank | Female Poverty |
| Immigrants | India | 100.0 /100 | #1 | Exceptional 9.9% |
| Chinese | 100.0 /100 | #2 | Exceptional 10.4% |
| Thais | 100.0 /100 | #3 | Exceptional 10.5% |
| Immigrants | Taiwan | 100.0 /100 | #4 | Exceptional 10.5% |
| Filipinos | 100.0 /100 | #5 | Exceptional 10.9% |
| Immigrants | Ireland | 99.9 /100 | #6 | Exceptional 11.0% |
| Assyrians/Chaldeans/Syriacs | 99.9 /100 | #7 | Exceptional 11.0% |
| Immigrants | South Central Asia | 99.9 /100 | #8 | Exceptional 11.1% |
| Bulgarians | 99.9 /100 | #9 | Exceptional 11.1% |
| Immigrants | Hong Kong | 99.9 /100 | #10 | Exceptional 11.2% |
| Maltese | 99.9 /100 | #11 | Exceptional 11.2% |
| Bhutanese | 99.9 /100 | #12 | Exceptional 11.3% |
| Immigrants | Lithuania | 99.9 /100 | #13 | Exceptional 11.3% |
| Lithuanians | 99.8 /100 | #14 | Exceptional 11.4% |
| Latvians | 99.8 /100 | #15 | Exceptional 11.4% |