Canadian vs Immigrants from Dominican Republic Receiving Food Stamps
COMPARE
Canadian
Immigrants from Dominican Republic
Receiving Food Stamps
Receiving Food Stamps Comparison
Canadians
Immigrants from Dominican Republic
10.5%
RECEIVING FOOD STAMPS
94.8/ 100
METRIC RATING
116th/ 347
METRIC RANK
22.1%
RECEIVING FOOD STAMPS
0.0/ 100
METRIC RATING
343rd/ 347
METRIC RANK
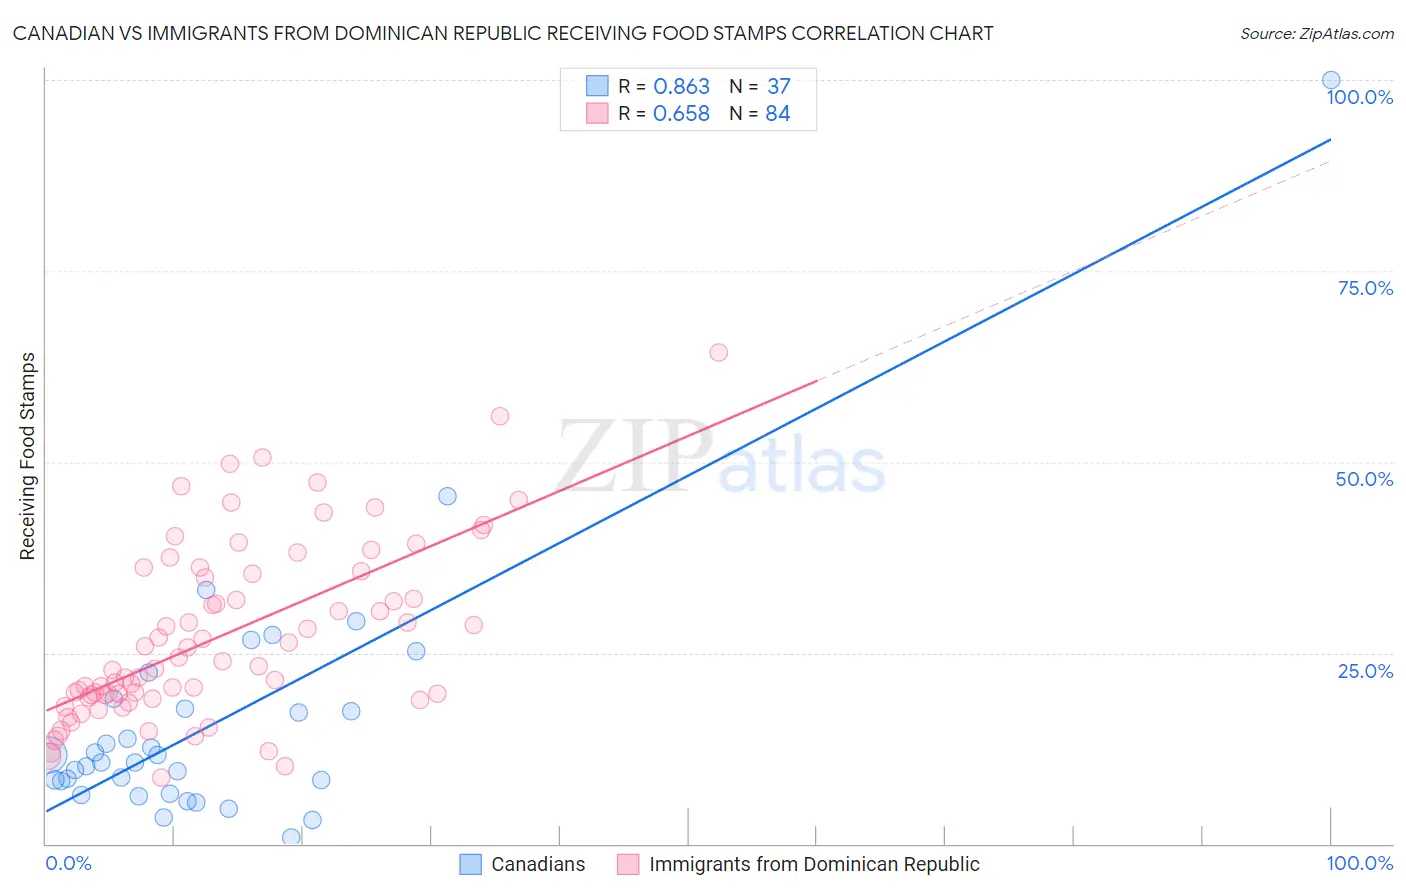
Canadian vs Immigrants from Dominican Republic Receiving Food Stamps Correlation Chart
The statistical analysis conducted on geographies consisting of 436,119,320 people shows a very strong positive correlation between the proportion of Canadians and percentage of population receiving government assistance and/or food stamps in the United States with a correlation coefficient (R) of 0.863 and weighted average of 10.5%. Similarly, the statistical analysis conducted on geographies consisting of 274,487,566 people shows a significant positive correlation between the proportion of Immigrants from Dominican Republic and percentage of population receiving government assistance and/or food stamps in the United States with a correlation coefficient (R) of 0.658 and weighted average of 22.1%, a difference of 109.8%.
Receiving Food Stamps Correlation Summary
| Measurement | Canadian | Immigrants from Dominican Republic |
| Minimum | 0.80% | 8.7% |
| Maximum | 100.0% | 64.4% |
| Range | 99.2% | 55.7% |
| Mean | 15.9% | 27.2% |
| Median | 10.7% | 23.6% |
| Interquartile 25% (IQ1) | 7.4% | 19.3% |
| Interquartile 75% (IQ3) | 18.4% | 35.5% |
| Interquartile Range (IQR) | 11.0% | 16.2% |
| Standard Deviation (Sample) | 17.1% | 11.5% |
| Standard Deviation (Population) | 16.9% | 11.5% |
Similar Demographics by Receiving Food Stamps
Demographics Similar to Canadians by Receiving Food Stamps
In terms of receiving food stamps, the demographic groups most similar to Canadians are Immigrants from Saudi Arabia (10.5%, a difference of 0.050%), Immigrants from Nepal (10.6%, a difference of 0.16%), Scotch-Irish (10.5%, a difference of 0.22%), Assyrian/Chaldean/Syriac (10.6%, a difference of 0.50%), and Icelander (10.5%, a difference of 0.52%).
| Demographics | Rating | Rank | Receiving Food Stamps |
| Immigrants | Pakistan | 96.2 /100 | #109 | Exceptional 10.4% |
| Pakistanis | 95.9 /100 | #110 | Exceptional 10.4% |
| Romanians | 95.8 /100 | #111 | Exceptional 10.4% |
| Mongolians | 95.8 /100 | #112 | Exceptional 10.5% |
| Icelanders | 95.4 /100 | #113 | Exceptional 10.5% |
| Scotch-Irish | 95.1 /100 | #114 | Exceptional 10.5% |
| Immigrants | Saudi Arabia | 94.9 /100 | #115 | Exceptional 10.5% |
| Canadians | 94.8 /100 | #116 | Exceptional 10.5% |
| Immigrants | Nepal | 94.6 /100 | #117 | Exceptional 10.6% |
| Assyrians/Chaldeans/Syriacs | 94.1 /100 | #118 | Exceptional 10.6% |
| Immigrants | Poland | 93.9 /100 | #119 | Exceptional 10.6% |
| Ethiopians | 93.9 /100 | #120 | Exceptional 10.6% |
| Slavs | 93.8 /100 | #121 | Exceptional 10.6% |
| Sri Lankans | 93.7 /100 | #122 | Exceptional 10.6% |
| Immigrants | Philippines | 93.3 /100 | #123 | Exceptional 10.7% |
Demographics Similar to Immigrants from Dominican Republic by Receiving Food Stamps
In terms of receiving food stamps, the demographic groups most similar to Immigrants from Dominican Republic are Immigrants from Yemen (21.6%, a difference of 2.2%), Hopi (21.6%, a difference of 2.7%), Tohono O'odham (21.5%, a difference of 3.0%), Yakama (21.4%, a difference of 3.3%), and Dominican (21.4%, a difference of 3.6%).
| Demographics | Rating | Rank | Receiving Food Stamps |
| Inupiat | 0.0 /100 | #333 | Tragic 20.1% |
| Yuman | 0.0 /100 | #334 | Tragic 20.2% |
| Immigrants | Cuba | 0.0 /100 | #335 | Tragic 20.8% |
| Navajo | 0.0 /100 | #336 | Tragic 21.1% |
| Cape Verdeans | 0.0 /100 | #337 | Tragic 21.1% |
| Dominicans | 0.0 /100 | #338 | Tragic 21.4% |
| Yakama | 0.0 /100 | #339 | Tragic 21.4% |
| Tohono O'odham | 0.0 /100 | #340 | Tragic 21.5% |
| Hopi | 0.0 /100 | #341 | Tragic 21.6% |
| Immigrants | Yemen | 0.0 /100 | #342 | Tragic 21.6% |
| Immigrants | Dominican Republic | 0.0 /100 | #343 | Tragic 22.1% |
| Lumbee | 0.0 /100 | #344 | Tragic 22.9% |
| Immigrants | Cabo Verde | 0.0 /100 | #345 | Tragic 23.8% |
| Puerto Ricans | 0.0 /100 | #346 | Tragic 26.0% |
| Yup'ik | 0.0 /100 | #347 | Tragic 32.7% |