Immigrants from Bahamas vs Immigrants from Dominican Republic Receiving Food Stamps
COMPARE
Immigrants from Bahamas
Immigrants from Dominican Republic
Receiving Food Stamps
Receiving Food Stamps Comparison
Immigrants from Bahamas
Immigrants from Dominican Republic
15.8%
RECEIVING FOOD STAMPS
0.0/ 100
METRIC RATING
297th/ 347
METRIC RANK
22.1%
RECEIVING FOOD STAMPS
0.0/ 100
METRIC RATING
343rd/ 347
METRIC RANK
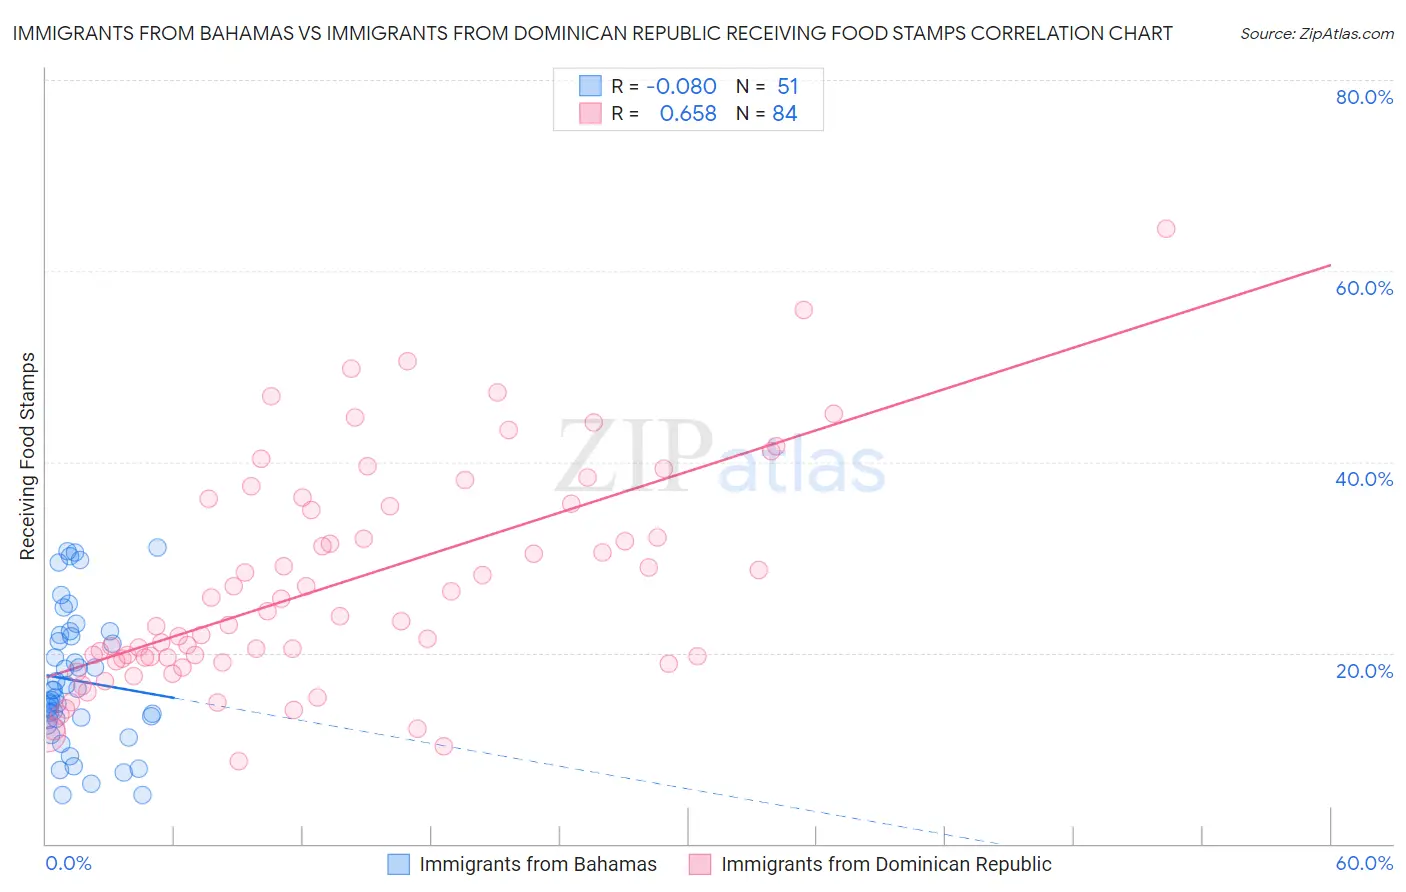
Immigrants from Bahamas vs Immigrants from Dominican Republic Receiving Food Stamps Correlation Chart
The statistical analysis conducted on geographies consisting of 104,572,016 people shows a slight negative correlation between the proportion of Immigrants from Bahamas and percentage of population receiving government assistance and/or food stamps in the United States with a correlation coefficient (R) of -0.080 and weighted average of 15.8%. Similarly, the statistical analysis conducted on geographies consisting of 274,487,566 people shows a significant positive correlation between the proportion of Immigrants from Dominican Republic and percentage of population receiving government assistance and/or food stamps in the United States with a correlation coefficient (R) of 0.658 and weighted average of 22.1%, a difference of 40.4%.
Receiving Food Stamps Correlation Summary
| Measurement | Immigrants from Bahamas | Immigrants from Dominican Republic |
| Minimum | 5.1% | 8.7% |
| Maximum | 31.0% | 64.4% |
| Range | 25.9% | 55.7% |
| Mean | 17.1% | 27.2% |
| Median | 16.0% | 23.6% |
| Interquartile 25% (IQ1) | 13.1% | 19.3% |
| Interquartile 75% (IQ3) | 21.8% | 35.5% |
| Interquartile Range (IQR) | 8.7% | 16.2% |
| Standard Deviation (Sample) | 7.1% | 11.5% |
| Standard Deviation (Population) | 7.0% | 11.5% |
Similar Demographics by Receiving Food Stamps
Demographics Similar to Immigrants from Bahamas by Receiving Food Stamps
In terms of receiving food stamps, the demographic groups most similar to Immigrants from Bahamas are Tsimshian (15.7%, a difference of 0.16%), Immigrants from Honduras (15.7%, a difference of 0.17%), Immigrants from Trinidad and Tobago (15.8%, a difference of 0.25%), Immigrants from Latin America (15.7%, a difference of 0.49%), and Hispanic or Latino (15.8%, a difference of 0.53%).
| Demographics | Rating | Rank | Receiving Food Stamps |
| Senegalese | 0.0 /100 | #290 | Tragic 15.4% |
| Hondurans | 0.0 /100 | #291 | Tragic 15.5% |
| Alaska Natives | 0.0 /100 | #292 | Tragic 15.6% |
| Vietnamese | 0.0 /100 | #293 | Tragic 15.7% |
| Immigrants | Latin America | 0.0 /100 | #294 | Tragic 15.7% |
| Immigrants | Honduras | 0.0 /100 | #295 | Tragic 15.7% |
| Tsimshian | 0.0 /100 | #296 | Tragic 15.7% |
| Immigrants | Bahamas | 0.0 /100 | #297 | Tragic 15.8% |
| Immigrants | Trinidad and Tobago | 0.0 /100 | #298 | Tragic 15.8% |
| Hispanics or Latinos | 0.0 /100 | #299 | Tragic 15.8% |
| Immigrants | Bangladesh | 0.0 /100 | #300 | Tragic 15.9% |
| Trinidadians and Tobagonians | 0.0 /100 | #301 | Tragic 16.0% |
| Immigrants | West Indies | 0.0 /100 | #302 | Tragic 16.1% |
| Nicaraguans | 0.0 /100 | #303 | Tragic 16.1% |
| West Indians | 0.0 /100 | #304 | Tragic 16.3% |
Demographics Similar to Immigrants from Dominican Republic by Receiving Food Stamps
In terms of receiving food stamps, the demographic groups most similar to Immigrants from Dominican Republic are Immigrants from Yemen (21.6%, a difference of 2.2%), Hopi (21.6%, a difference of 2.7%), Tohono O'odham (21.5%, a difference of 3.0%), Yakama (21.4%, a difference of 3.3%), and Dominican (21.4%, a difference of 3.6%).
| Demographics | Rating | Rank | Receiving Food Stamps |
| Inupiat | 0.0 /100 | #333 | Tragic 20.1% |
| Yuman | 0.0 /100 | #334 | Tragic 20.2% |
| Immigrants | Cuba | 0.0 /100 | #335 | Tragic 20.8% |
| Navajo | 0.0 /100 | #336 | Tragic 21.1% |
| Cape Verdeans | 0.0 /100 | #337 | Tragic 21.1% |
| Dominicans | 0.0 /100 | #338 | Tragic 21.4% |
| Yakama | 0.0 /100 | #339 | Tragic 21.4% |
| Tohono O'odham | 0.0 /100 | #340 | Tragic 21.5% |
| Hopi | 0.0 /100 | #341 | Tragic 21.6% |
| Immigrants | Yemen | 0.0 /100 | #342 | Tragic 21.6% |
| Immigrants | Dominican Republic | 0.0 /100 | #343 | Tragic 22.1% |
| Lumbee | 0.0 /100 | #344 | Tragic 22.9% |
| Immigrants | Cabo Verde | 0.0 /100 | #345 | Tragic 23.8% |
| Puerto Ricans | 0.0 /100 | #346 | Tragic 26.0% |
| Yup'ik | 0.0 /100 | #347 | Tragic 32.7% |