Immigrants from Ghana vs Immigrants from Dominican Republic Receiving Food Stamps
COMPARE
Immigrants from Ghana
Immigrants from Dominican Republic
Receiving Food Stamps
Receiving Food Stamps Comparison
Immigrants from Ghana
Immigrants from Dominican Republic
14.1%
RECEIVING FOOD STAMPS
0.3/ 100
METRIC RATING
258th/ 347
METRIC RANK
22.1%
RECEIVING FOOD STAMPS
0.0/ 100
METRIC RATING
343rd/ 347
METRIC RANK
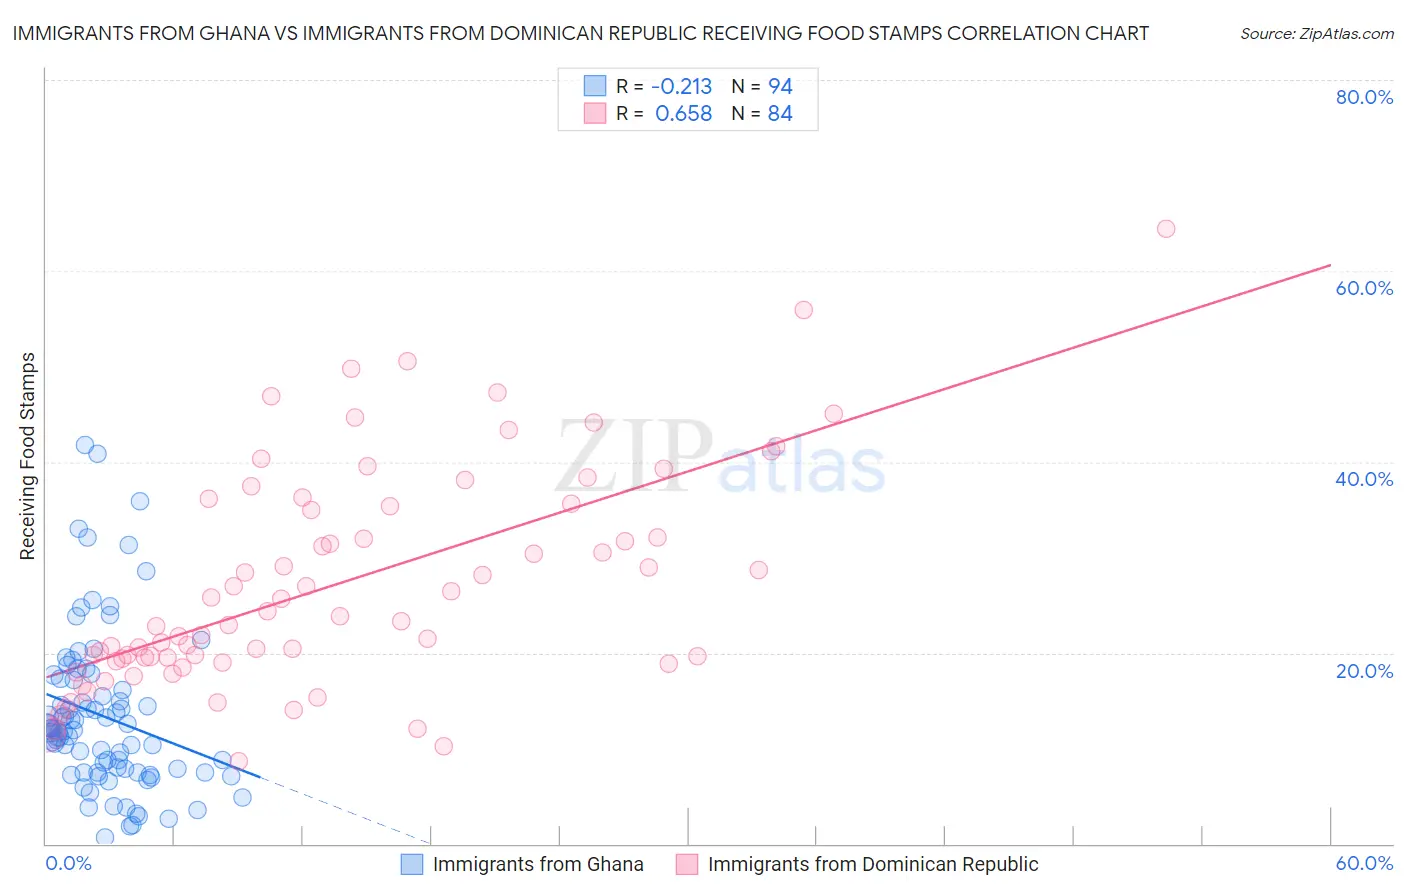
Immigrants from Ghana vs Immigrants from Dominican Republic Receiving Food Stamps Correlation Chart
The statistical analysis conducted on geographies consisting of 199,399,375 people shows a weak negative correlation between the proportion of Immigrants from Ghana and percentage of population receiving government assistance and/or food stamps in the United States with a correlation coefficient (R) of -0.213 and weighted average of 14.1%. Similarly, the statistical analysis conducted on geographies consisting of 274,487,566 people shows a significant positive correlation between the proportion of Immigrants from Dominican Republic and percentage of population receiving government assistance and/or food stamps in the United States with a correlation coefficient (R) of 0.658 and weighted average of 22.1%, a difference of 56.7%.
Receiving Food Stamps Correlation Summary
| Measurement | Immigrants from Ghana | Immigrants from Dominican Republic |
| Minimum | 0.70% | 8.7% |
| Maximum | 41.8% | 64.4% |
| Range | 41.1% | 55.7% |
| Mean | 13.4% | 27.2% |
| Median | 11.9% | 23.6% |
| Interquartile 25% (IQ1) | 7.5% | 19.3% |
| Interquartile 75% (IQ3) | 17.1% | 35.5% |
| Interquartile Range (IQR) | 9.6% | 16.2% |
| Standard Deviation (Sample) | 8.3% | 11.5% |
| Standard Deviation (Population) | 8.3% | 11.5% |
Similar Demographics by Receiving Food Stamps
Demographics Similar to Immigrants from Ghana by Receiving Food Stamps
In terms of receiving food stamps, the demographic groups most similar to Immigrants from Ghana are Arapaho (14.1%, a difference of 0.080%), Creek (14.1%, a difference of 0.12%), Japanese (14.1%, a difference of 0.18%), Subsaharan African (14.1%, a difference of 0.20%), and Marshallese (14.1%, a difference of 0.21%).
| Demographics | Rating | Rank | Receiving Food Stamps |
| Yaqui | 0.5 /100 | #251 | Tragic 13.9% |
| Ghanaians | 0.5 /100 | #252 | Tragic 14.0% |
| Spanish Americans | 0.4 /100 | #253 | Tragic 14.0% |
| Marshallese | 0.3 /100 | #254 | Tragic 14.1% |
| Sub-Saharan Africans | 0.3 /100 | #255 | Tragic 14.1% |
| Japanese | 0.3 /100 | #256 | Tragic 14.1% |
| Arapaho | 0.3 /100 | #257 | Tragic 14.1% |
| Immigrants | Ghana | 0.3 /100 | #258 | Tragic 14.1% |
| Creek | 0.3 /100 | #259 | Tragic 14.1% |
| Central Americans | 0.3 /100 | #260 | Tragic 14.1% |
| Immigrants | Congo | 0.3 /100 | #261 | Tragic 14.1% |
| Paiute | 0.2 /100 | #262 | Tragic 14.3% |
| Immigrants | Portugal | 0.2 /100 | #263 | Tragic 14.3% |
| Immigrants | Uzbekistan | 0.2 /100 | #264 | Tragic 14.3% |
| Blackfeet | 0.2 /100 | #265 | Tragic 14.3% |
Demographics Similar to Immigrants from Dominican Republic by Receiving Food Stamps
In terms of receiving food stamps, the demographic groups most similar to Immigrants from Dominican Republic are Immigrants from Yemen (21.6%, a difference of 2.2%), Hopi (21.6%, a difference of 2.7%), Tohono O'odham (21.5%, a difference of 3.0%), Yakama (21.4%, a difference of 3.3%), and Dominican (21.4%, a difference of 3.6%).
| Demographics | Rating | Rank | Receiving Food Stamps |
| Inupiat | 0.0 /100 | #333 | Tragic 20.1% |
| Yuman | 0.0 /100 | #334 | Tragic 20.2% |
| Immigrants | Cuba | 0.0 /100 | #335 | Tragic 20.8% |
| Navajo | 0.0 /100 | #336 | Tragic 21.1% |
| Cape Verdeans | 0.0 /100 | #337 | Tragic 21.1% |
| Dominicans | 0.0 /100 | #338 | Tragic 21.4% |
| Yakama | 0.0 /100 | #339 | Tragic 21.4% |
| Tohono O'odham | 0.0 /100 | #340 | Tragic 21.5% |
| Hopi | 0.0 /100 | #341 | Tragic 21.6% |
| Immigrants | Yemen | 0.0 /100 | #342 | Tragic 21.6% |
| Immigrants | Dominican Republic | 0.0 /100 | #343 | Tragic 22.1% |
| Lumbee | 0.0 /100 | #344 | Tragic 22.9% |
| Immigrants | Cabo Verde | 0.0 /100 | #345 | Tragic 23.8% |
| Puerto Ricans | 0.0 /100 | #346 | Tragic 26.0% |
| Yup'ik | 0.0 /100 | #347 | Tragic 32.7% |