Osage vs Sudanese Family Poverty
COMPARE
Osage
Sudanese
Family Poverty
Family Poverty Comparison
Osage
Sudanese
9.7%
FAMILY POVERTY
8.0/ 100
METRIC RATING
213th/ 347
METRIC RANK
10.0%
FAMILY POVERTY
3.1/ 100
METRIC RATING
228th/ 347
METRIC RANK
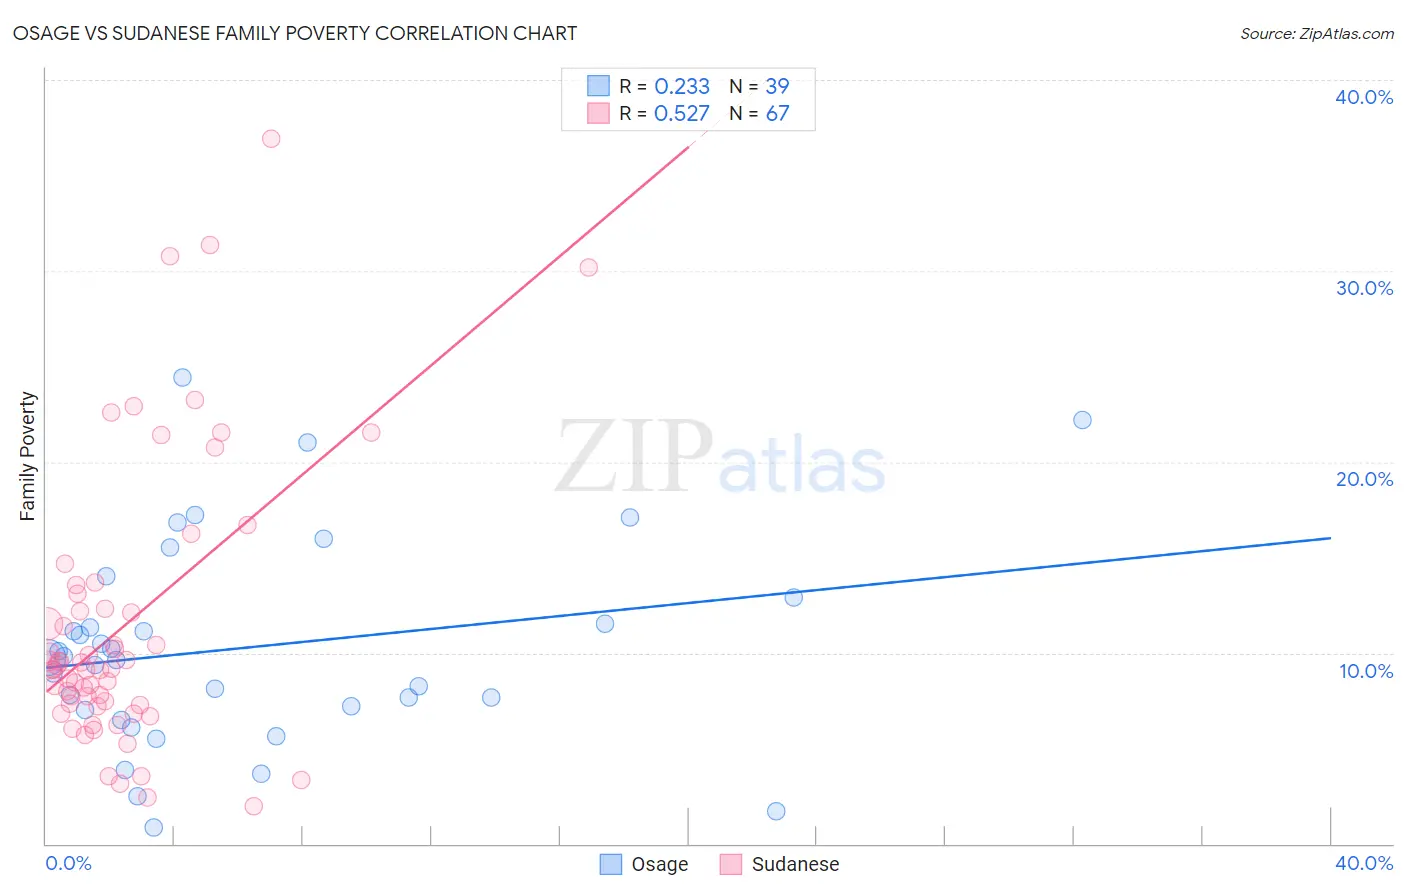
Osage vs Sudanese Family Poverty Correlation Chart
The statistical analysis conducted on geographies consisting of 91,772,722 people shows a weak positive correlation between the proportion of Osage and poverty level among families in the United States with a correlation coefficient (R) of 0.233 and weighted average of 9.7%. Similarly, the statistical analysis conducted on geographies consisting of 110,085,531 people shows a substantial positive correlation between the proportion of Sudanese and poverty level among families in the United States with a correlation coefficient (R) of 0.527 and weighted average of 10.0%, a difference of 3.0%.
Family Poverty Correlation Summary
| Measurement | Osage | Sudanese |
| Minimum | 0.88% | 1.9% |
| Maximum | 24.4% | 36.9% |
| Range | 23.6% | 35.0% |
| Mean | 10.3% | 11.5% |
| Median | 9.8% | 9.2% |
| Interquartile 25% (IQ1) | 7.0% | 7.3% |
| Interquartile 75% (IQ3) | 12.9% | 13.1% |
| Interquartile Range (IQR) | 5.9% | 5.8% |
| Standard Deviation (Sample) | 5.4% | 7.3% |
| Standard Deviation (Population) | 5.4% | 7.3% |
Demographics Similar to Osage and Sudanese by Family Poverty
In terms of family poverty, the demographic groups most similar to Osage are Immigrants from Micronesia (9.8%, a difference of 0.58%), Nonimmigrants (9.8%, a difference of 0.61%), Immigrants from Thailand (9.7%, a difference of 0.63%), Moroccan (9.8%, a difference of 0.67%), and American (9.8%, a difference of 0.87%). Similarly, the demographic groups most similar to Sudanese are Immigrants from Uzbekistan (10.0%, a difference of 0.010%), Immigrants from Panama (10.0%, a difference of 0.030%), Immigrants from Armenia (10.0%, a difference of 0.20%), Ottawa (10.0%, a difference of 0.22%), and Immigrants (10.0%, a difference of 0.49%).
| Demographics | Rating | Rank | Family Poverty |
| Alsatians | 11.3 /100 | #210 | Poor 9.6% |
| Malaysians | 10.6 /100 | #211 | Poor 9.6% |
| Immigrants | Thailand | 9.7 /100 | #212 | Tragic 9.7% |
| Osage | 8.0 /100 | #213 | Tragic 9.7% |
| Immigrants | Micronesia | 6.7 /100 | #214 | Tragic 9.8% |
| Immigrants | Nonimmigrants | 6.7 /100 | #215 | Tragic 9.8% |
| Moroccans | 6.5 /100 | #216 | Tragic 9.8% |
| Americans | 6.2 /100 | #217 | Tragic 9.8% |
| Panamanians | 5.6 /100 | #218 | Tragic 9.8% |
| Immigrants | Eritrea | 5.4 /100 | #219 | Tragic 9.9% |
| Bermudans | 5.3 /100 | #220 | Tragic 9.9% |
| Immigrants | Cambodia | 4.8 /100 | #221 | Tragic 9.9% |
| Japanese | 4.8 /100 | #222 | Tragic 9.9% |
| Immigrants | Africa | 4.3 /100 | #223 | Tragic 9.9% |
| Marshallese | 3.9 /100 | #224 | Tragic 9.9% |
| Immigrants | Immigrants | 3.6 /100 | #225 | Tragic 10.0% |
| Ottawa | 3.3 /100 | #226 | Tragic 10.0% |
| Immigrants | Armenia | 3.3 /100 | #227 | Tragic 10.0% |
| Sudanese | 3.1 /100 | #228 | Tragic 10.0% |
| Immigrants | Uzbekistan | 3.1 /100 | #229 | Tragic 10.0% |
| Immigrants | Panama | 3.1 /100 | #230 | Tragic 10.0% |