Osage vs Menominee Family Poverty
COMPARE
Osage
Menominee
Family Poverty
Family Poverty Comparison
Osage
Menominee
9.7%
FAMILY POVERTY
8.0/ 100
METRIC RATING
213th/ 347
METRIC RANK
12.7%
FAMILY POVERTY
0.0/ 100
METRIC RATING
323rd/ 347
METRIC RANK
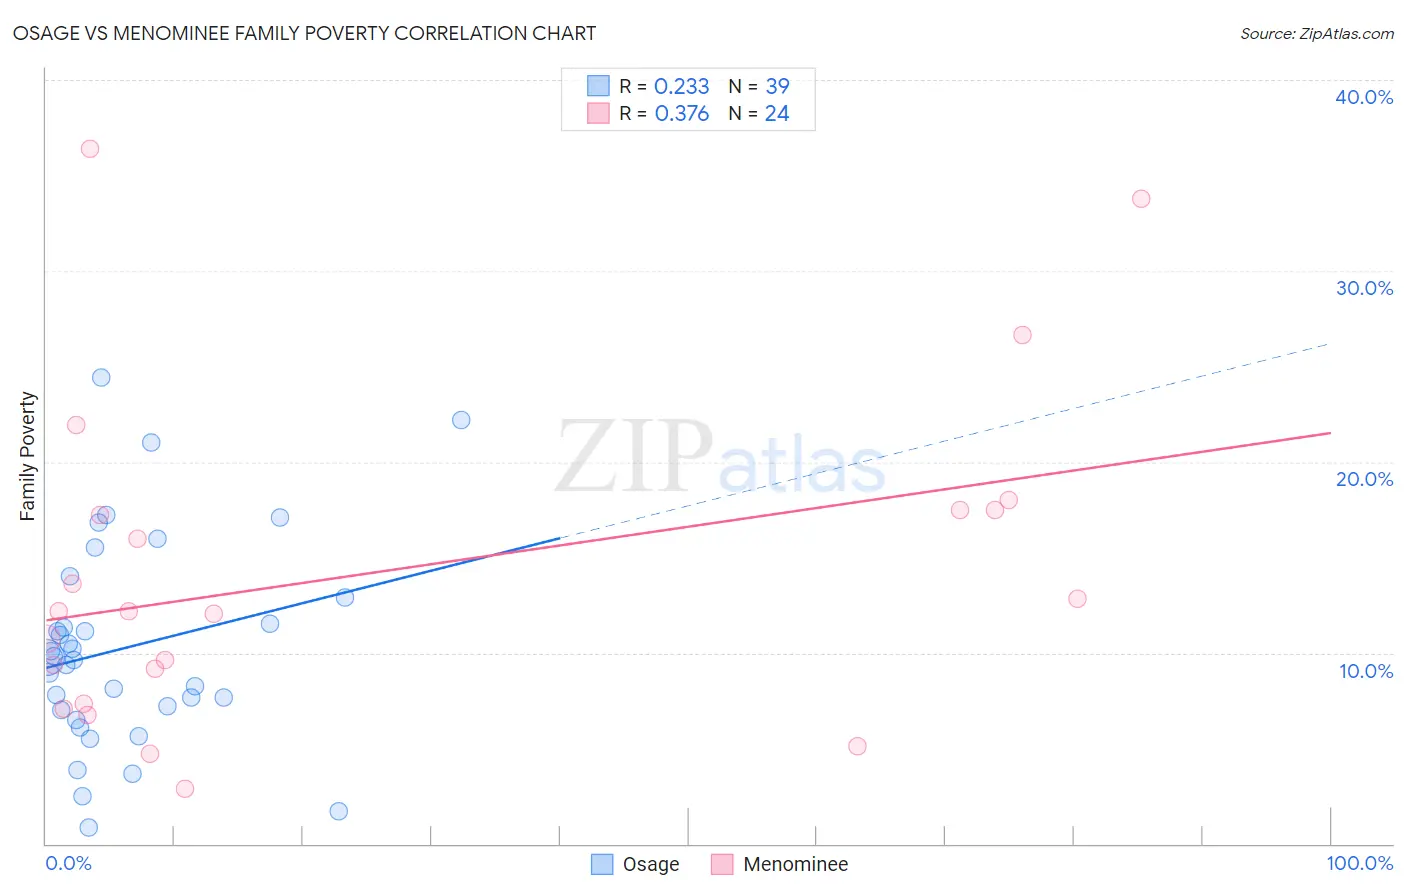
Osage vs Menominee Family Poverty Correlation Chart
The statistical analysis conducted on geographies consisting of 91,772,722 people shows a weak positive correlation between the proportion of Osage and poverty level among families in the United States with a correlation coefficient (R) of 0.233 and weighted average of 9.7%. Similarly, the statistical analysis conducted on geographies consisting of 45,766,702 people shows a mild positive correlation between the proportion of Menominee and poverty level among families in the United States with a correlation coefficient (R) of 0.376 and weighted average of 12.7%, a difference of 30.9%.
Family Poverty Correlation Summary
| Measurement | Osage | Menominee |
| Minimum | 0.88% | 2.9% |
| Maximum | 24.4% | 36.4% |
| Range | 23.6% | 33.5% |
| Mean | 10.3% | 14.2% |
| Median | 9.8% | 12.2% |
| Interquartile 25% (IQ1) | 7.0% | 8.2% |
| Interquartile 75% (IQ3) | 12.9% | 17.5% |
| Interquartile Range (IQR) | 5.9% | 9.3% |
| Standard Deviation (Sample) | 5.4% | 8.6% |
| Standard Deviation (Population) | 5.4% | 8.4% |
Similar Demographics by Family Poverty
Demographics Similar to Osage by Family Poverty
In terms of family poverty, the demographic groups most similar to Osage are Immigrants from Micronesia (9.8%, a difference of 0.58%), Nonimmigrants (9.8%, a difference of 0.61%), Immigrants from Thailand (9.7%, a difference of 0.63%), Moroccan (9.8%, a difference of 0.67%), and American (9.8%, a difference of 0.87%).
| Demographics | Rating | Rank | Family Poverty |
| Immigrants | South America | 18.0 /100 | #206 | Poor 9.5% |
| Sierra Leoneans | 15.6 /100 | #207 | Poor 9.5% |
| Immigrants | Eastern Africa | 15.1 /100 | #208 | Poor 9.5% |
| Immigrants | Uruguay | 14.0 /100 | #209 | Poor 9.5% |
| Alsatians | 11.3 /100 | #210 | Poor 9.6% |
| Malaysians | 10.6 /100 | #211 | Poor 9.6% |
| Immigrants | Thailand | 9.7 /100 | #212 | Tragic 9.7% |
| Osage | 8.0 /100 | #213 | Tragic 9.7% |
| Immigrants | Micronesia | 6.7 /100 | #214 | Tragic 9.8% |
| Immigrants | Nonimmigrants | 6.7 /100 | #215 | Tragic 9.8% |
| Moroccans | 6.5 /100 | #216 | Tragic 9.8% |
| Americans | 6.2 /100 | #217 | Tragic 9.8% |
| Panamanians | 5.6 /100 | #218 | Tragic 9.8% |
| Immigrants | Eritrea | 5.4 /100 | #219 | Tragic 9.9% |
| Bermudans | 5.3 /100 | #220 | Tragic 9.9% |
Demographics Similar to Menominee by Family Poverty
In terms of family poverty, the demographic groups most similar to Menominee are Immigrants from Dominica (12.7%, a difference of 0.080%), Immigrants from Honduras (12.7%, a difference of 0.54%), Arapaho (12.7%, a difference of 0.65%), Paiute (13.0%, a difference of 2.0%), and Colville (13.0%, a difference of 2.1%).
| Demographics | Rating | Rank | Family Poverty |
| Hondurans | 0.0 /100 | #316 | Tragic 12.4% |
| Immigrants | Grenada | 0.0 /100 | #317 | Tragic 12.4% |
| U.S. Virgin Islanders | 0.0 /100 | #318 | Tragic 12.4% |
| British West Indians | 0.0 /100 | #319 | Tragic 12.4% |
| Inupiat | 0.0 /100 | #320 | Tragic 12.5% |
| Arapaho | 0.0 /100 | #321 | Tragic 12.7% |
| Immigrants | Honduras | 0.0 /100 | #322 | Tragic 12.7% |
| Menominee | 0.0 /100 | #323 | Tragic 12.7% |
| Immigrants | Dominica | 0.0 /100 | #324 | Tragic 12.7% |
| Paiute | 0.0 /100 | #325 | Tragic 13.0% |
| Colville | 0.0 /100 | #326 | Tragic 13.0% |
| Yakama | 0.0 /100 | #327 | Tragic 13.1% |
| Central American Indians | 0.0 /100 | #328 | Tragic 13.3% |
| Blacks/African Americans | 0.0 /100 | #329 | Tragic 13.3% |
| Natives/Alaskans | 0.0 /100 | #330 | Tragic 14.3% |