Immigrants from Scotland vs Sudanese Family Poverty
COMPARE
Immigrants from Scotland
Sudanese
Family Poverty
Family Poverty Comparison
Immigrants from Scotland
Sudanese
7.3%
FAMILY POVERTY
99.6/ 100
METRIC RATING
27th/ 347
METRIC RANK
10.0%
FAMILY POVERTY
3.1/ 100
METRIC RATING
228th/ 347
METRIC RANK
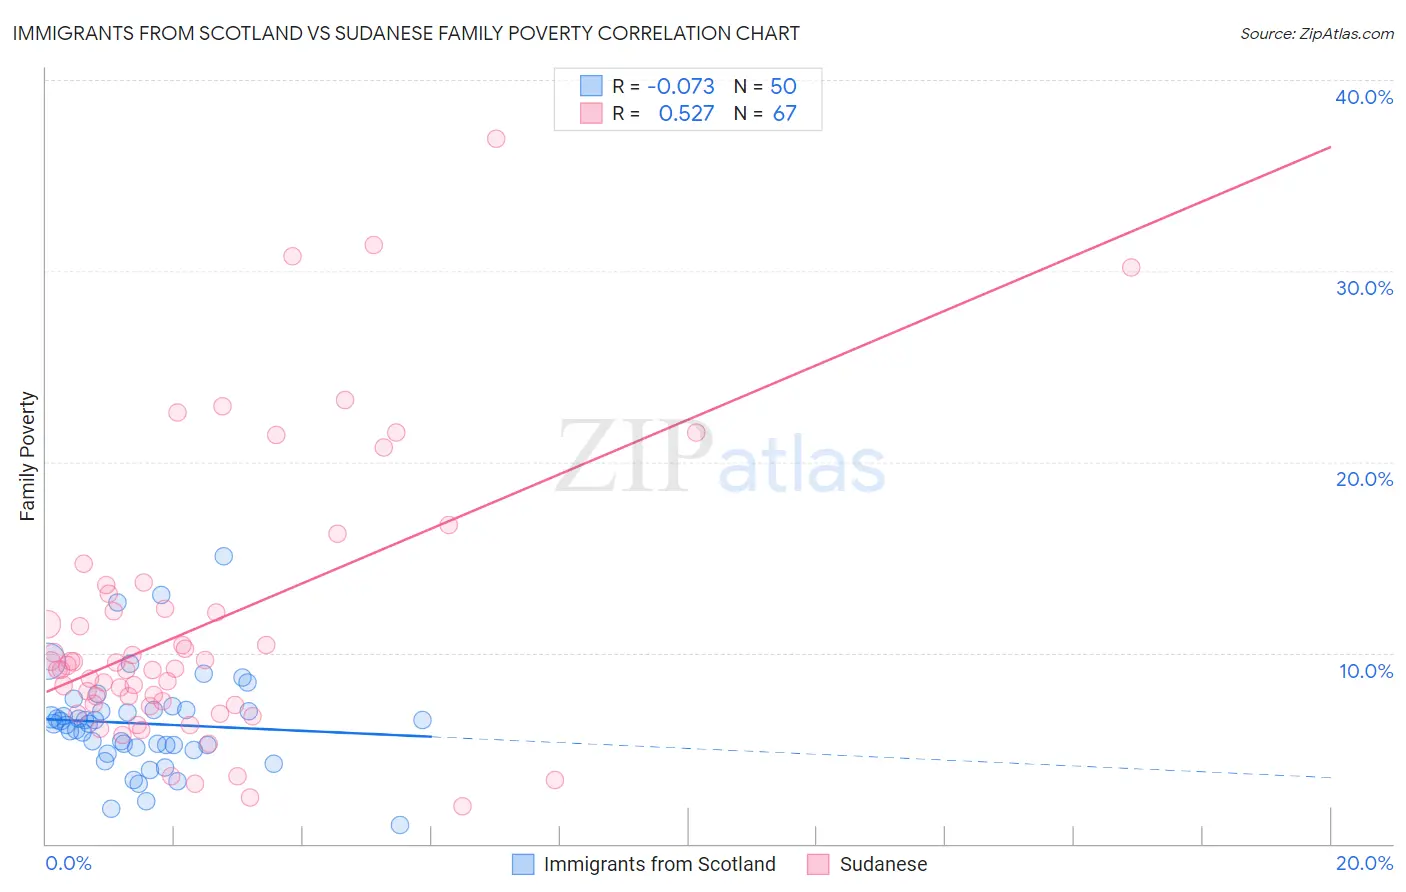
Immigrants from Scotland vs Sudanese Family Poverty Correlation Chart
The statistical analysis conducted on geographies consisting of 196,152,148 people shows a slight negative correlation between the proportion of Immigrants from Scotland and poverty level among families in the United States with a correlation coefficient (R) of -0.073 and weighted average of 7.3%. Similarly, the statistical analysis conducted on geographies consisting of 110,085,531 people shows a substantial positive correlation between the proportion of Sudanese and poverty level among families in the United States with a correlation coefficient (R) of 0.527 and weighted average of 10.0%, a difference of 36.5%.
Family Poverty Correlation Summary
| Measurement | Immigrants from Scotland | Sudanese |
| Minimum | 1.00% | 1.9% |
| Maximum | 15.1% | 36.9% |
| Range | 14.1% | 35.0% |
| Mean | 6.3% | 11.5% |
| Median | 6.3% | 9.2% |
| Interquartile 25% (IQ1) | 5.0% | 7.3% |
| Interquartile 75% (IQ3) | 7.0% | 13.1% |
| Interquartile Range (IQR) | 2.0% | 5.8% |
| Standard Deviation (Sample) | 2.6% | 7.3% |
| Standard Deviation (Population) | 2.6% | 7.3% |
Similar Demographics by Family Poverty
Demographics Similar to Immigrants from Scotland by Family Poverty
In terms of family poverty, the demographic groups most similar to Immigrants from Scotland are Cypriot (7.3%, a difference of 0.020%), Croatian (7.3%, a difference of 0.26%), Burmese (7.3%, a difference of 0.26%), Immigrants from Korea (7.4%, a difference of 0.39%), and Immigrants from Northern Europe (7.4%, a difference of 0.55%).
| Demographics | Rating | Rank | Family Poverty |
| Immigrants | Hong Kong | 99.7 /100 | #20 | Exceptional 7.3% |
| Immigrants | Iran | 99.7 /100 | #21 | Exceptional 7.3% |
| Danes | 99.7 /100 | #22 | Exceptional 7.3% |
| Assyrians/Chaldeans/Syriacs | 99.7 /100 | #23 | Exceptional 7.3% |
| Croatians | 99.7 /100 | #24 | Exceptional 7.3% |
| Burmese | 99.7 /100 | #25 | Exceptional 7.3% |
| Cypriots | 99.6 /100 | #26 | Exceptional 7.3% |
| Immigrants | Scotland | 99.6 /100 | #27 | Exceptional 7.3% |
| Immigrants | Korea | 99.6 /100 | #28 | Exceptional 7.4% |
| Immigrants | Northern Europe | 99.6 /100 | #29 | Exceptional 7.4% |
| Italians | 99.6 /100 | #30 | Exceptional 7.4% |
| Czechs | 99.6 /100 | #31 | Exceptional 7.4% |
| Poles | 99.5 /100 | #32 | Exceptional 7.4% |
| Immigrants | Japan | 99.5 /100 | #33 | Exceptional 7.4% |
| Russians | 99.5 /100 | #34 | Exceptional 7.5% |
Demographics Similar to Sudanese by Family Poverty
In terms of family poverty, the demographic groups most similar to Sudanese are Immigrants from Uzbekistan (10.0%, a difference of 0.010%), Immigrants from Panama (10.0%, a difference of 0.030%), Immigrants from Armenia (10.0%, a difference of 0.20%), Ottawa (10.0%, a difference of 0.22%), and Alaskan Athabascan (10.1%, a difference of 0.41%).
| Demographics | Rating | Rank | Family Poverty |
| Immigrants | Cambodia | 4.8 /100 | #221 | Tragic 9.9% |
| Japanese | 4.8 /100 | #222 | Tragic 9.9% |
| Immigrants | Africa | 4.3 /100 | #223 | Tragic 9.9% |
| Marshallese | 3.9 /100 | #224 | Tragic 9.9% |
| Immigrants | Immigrants | 3.6 /100 | #225 | Tragic 10.0% |
| Ottawa | 3.3 /100 | #226 | Tragic 10.0% |
| Immigrants | Armenia | 3.3 /100 | #227 | Tragic 10.0% |
| Sudanese | 3.1 /100 | #228 | Tragic 10.0% |
| Immigrants | Uzbekistan | 3.1 /100 | #229 | Tragic 10.0% |
| Immigrants | Panama | 3.1 /100 | #230 | Tragic 10.0% |
| Alaskan Athabascans | 2.7 /100 | #231 | Tragic 10.1% |
| Immigrants | Sudan | 2.3 /100 | #232 | Tragic 10.1% |
| Fijians | 2.1 /100 | #233 | Tragic 10.1% |
| Immigrants | Middle Africa | 2.1 /100 | #234 | Tragic 10.1% |
| Nigerians | 2.0 /100 | #235 | Tragic 10.1% |