Latvian vs Sudanese Family Poverty
COMPARE
Latvian
Sudanese
Family Poverty
Family Poverty Comparison
Latvians
Sudanese
7.1%
FAMILY POVERTY
99.9/ 100
METRIC RATING
9th/ 347
METRIC RANK
10.0%
FAMILY POVERTY
3.1/ 100
METRIC RATING
228th/ 347
METRIC RANK
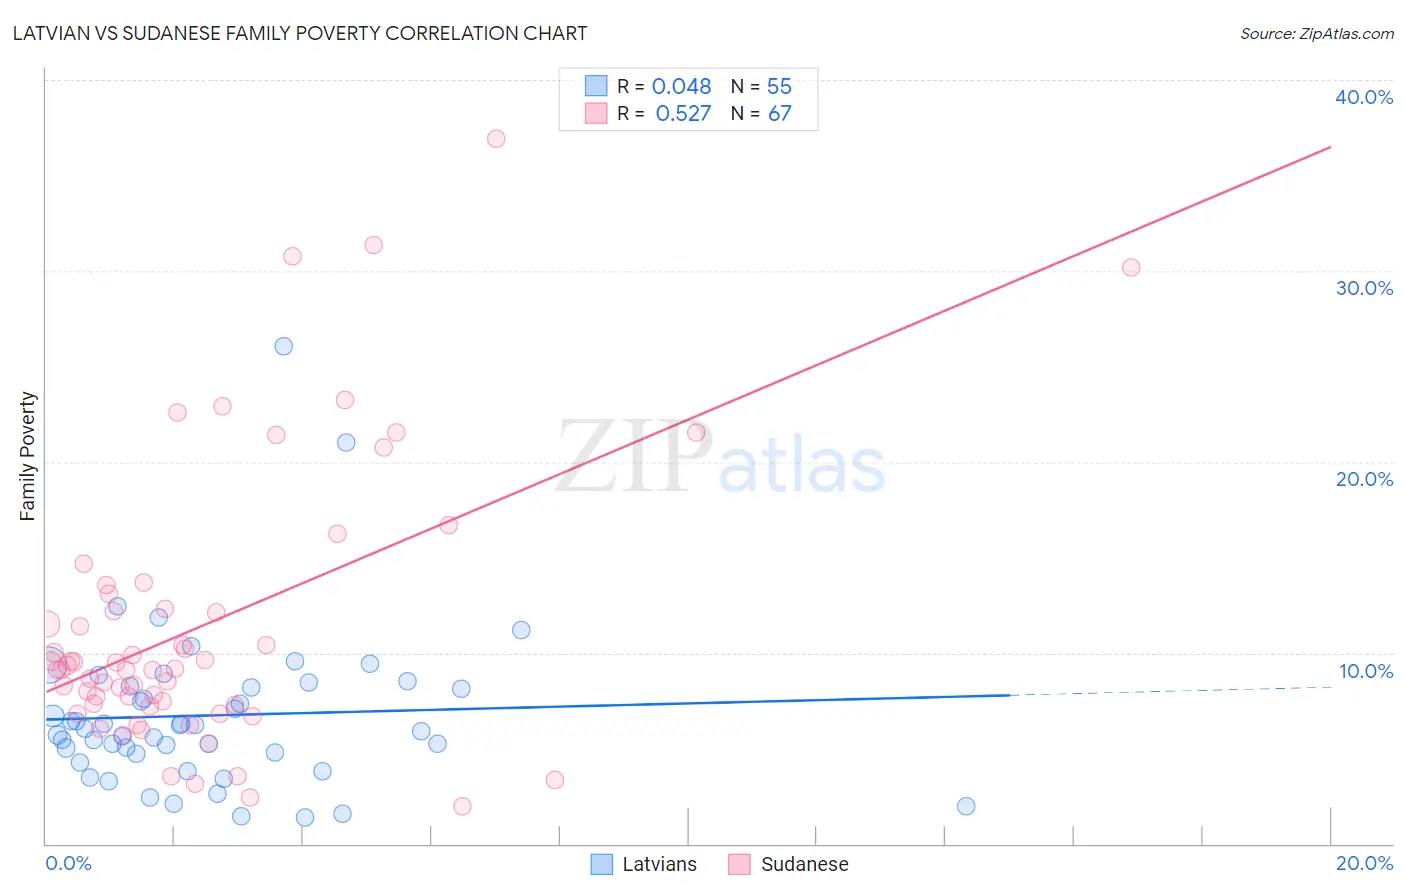
Latvian vs Sudanese Family Poverty Correlation Chart
The statistical analysis conducted on geographies consisting of 220,290,550 people shows no correlation between the proportion of Latvians and poverty level among families in the United States with a correlation coefficient (R) of 0.048 and weighted average of 7.1%. Similarly, the statistical analysis conducted on geographies consisting of 110,085,531 people shows a substantial positive correlation between the proportion of Sudanese and poverty level among families in the United States with a correlation coefficient (R) of 0.527 and weighted average of 10.0%, a difference of 41.6%.
Family Poverty Correlation Summary
| Measurement | Latvian | Sudanese |
| Minimum | 1.4% | 1.9% |
| Maximum | 26.1% | 36.9% |
| Range | 24.7% | 35.0% |
| Mean | 6.7% | 11.5% |
| Median | 6.0% | 9.2% |
| Interquartile 25% (IQ1) | 4.7% | 7.3% |
| Interquartile 75% (IQ3) | 8.3% | 13.1% |
| Interquartile Range (IQR) | 3.5% | 5.8% |
| Standard Deviation (Sample) | 4.2% | 7.3% |
| Standard Deviation (Population) | 4.2% | 7.3% |
Similar Demographics by Family Poverty
Demographics Similar to Latvians by Family Poverty
In terms of family poverty, the demographic groups most similar to Latvians are Bulgarian (7.1%, a difference of 0.25%), Immigrants from Singapore (7.1%, a difference of 0.27%), Bhutanese (7.0%, a difference of 0.44%), Maltese (7.1%, a difference of 0.55%), and Swedish (7.1%, a difference of 0.60%).
| Demographics | Rating | Rank | Family Poverty |
| Chinese | 100.0 /100 | #2 | Exceptional 6.5% |
| Immigrants | Taiwan | 100.0 /100 | #3 | Exceptional 6.6% |
| Filipinos | 100.0 /100 | #4 | Exceptional 6.6% |
| Thais | 100.0 /100 | #5 | Exceptional 6.7% |
| Norwegians | 99.9 /100 | #6 | Exceptional 6.9% |
| Immigrants | Ireland | 99.9 /100 | #7 | Exceptional 7.0% |
| Bhutanese | 99.9 /100 | #8 | Exceptional 7.0% |
| Latvians | 99.9 /100 | #9 | Exceptional 7.1% |
| Bulgarians | 99.8 /100 | #10 | Exceptional 7.1% |
| Immigrants | Singapore | 99.8 /100 | #11 | Exceptional 7.1% |
| Maltese | 99.8 /100 | #12 | Exceptional 7.1% |
| Swedes | 99.8 /100 | #13 | Exceptional 7.1% |
| Iranians | 99.8 /100 | #14 | Exceptional 7.1% |
| Lithuanians | 99.8 /100 | #15 | Exceptional 7.2% |
| Immigrants | South Central Asia | 99.8 /100 | #16 | Exceptional 7.2% |
Demographics Similar to Sudanese by Family Poverty
In terms of family poverty, the demographic groups most similar to Sudanese are Immigrants from Uzbekistan (10.0%, a difference of 0.010%), Immigrants from Panama (10.0%, a difference of 0.030%), Immigrants from Armenia (10.0%, a difference of 0.20%), Ottawa (10.0%, a difference of 0.22%), and Alaskan Athabascan (10.1%, a difference of 0.41%).
| Demographics | Rating | Rank | Family Poverty |
| Immigrants | Cambodia | 4.8 /100 | #221 | Tragic 9.9% |
| Japanese | 4.8 /100 | #222 | Tragic 9.9% |
| Immigrants | Africa | 4.3 /100 | #223 | Tragic 9.9% |
| Marshallese | 3.9 /100 | #224 | Tragic 9.9% |
| Immigrants | Immigrants | 3.6 /100 | #225 | Tragic 10.0% |
| Ottawa | 3.3 /100 | #226 | Tragic 10.0% |
| Immigrants | Armenia | 3.3 /100 | #227 | Tragic 10.0% |
| Sudanese | 3.1 /100 | #228 | Tragic 10.0% |
| Immigrants | Uzbekistan | 3.1 /100 | #229 | Tragic 10.0% |
| Immigrants | Panama | 3.1 /100 | #230 | Tragic 10.0% |
| Alaskan Athabascans | 2.7 /100 | #231 | Tragic 10.1% |
| Immigrants | Sudan | 2.3 /100 | #232 | Tragic 10.1% |
| Fijians | 2.1 /100 | #233 | Tragic 10.1% |
| Immigrants | Middle Africa | 2.1 /100 | #234 | Tragic 10.1% |
| Nigerians | 2.0 /100 | #235 | Tragic 10.1% |