Osage vs Immigrants from Cameroon Family Poverty
COMPARE
Osage
Immigrants from Cameroon
Family Poverty
Family Poverty Comparison
Osage
Immigrants from Cameroon
9.7%
FAMILY POVERTY
8.0/ 100
METRIC RATING
213th/ 347
METRIC RANK
9.0%
FAMILY POVERTY
47.1/ 100
METRIC RATING
178th/ 347
METRIC RANK
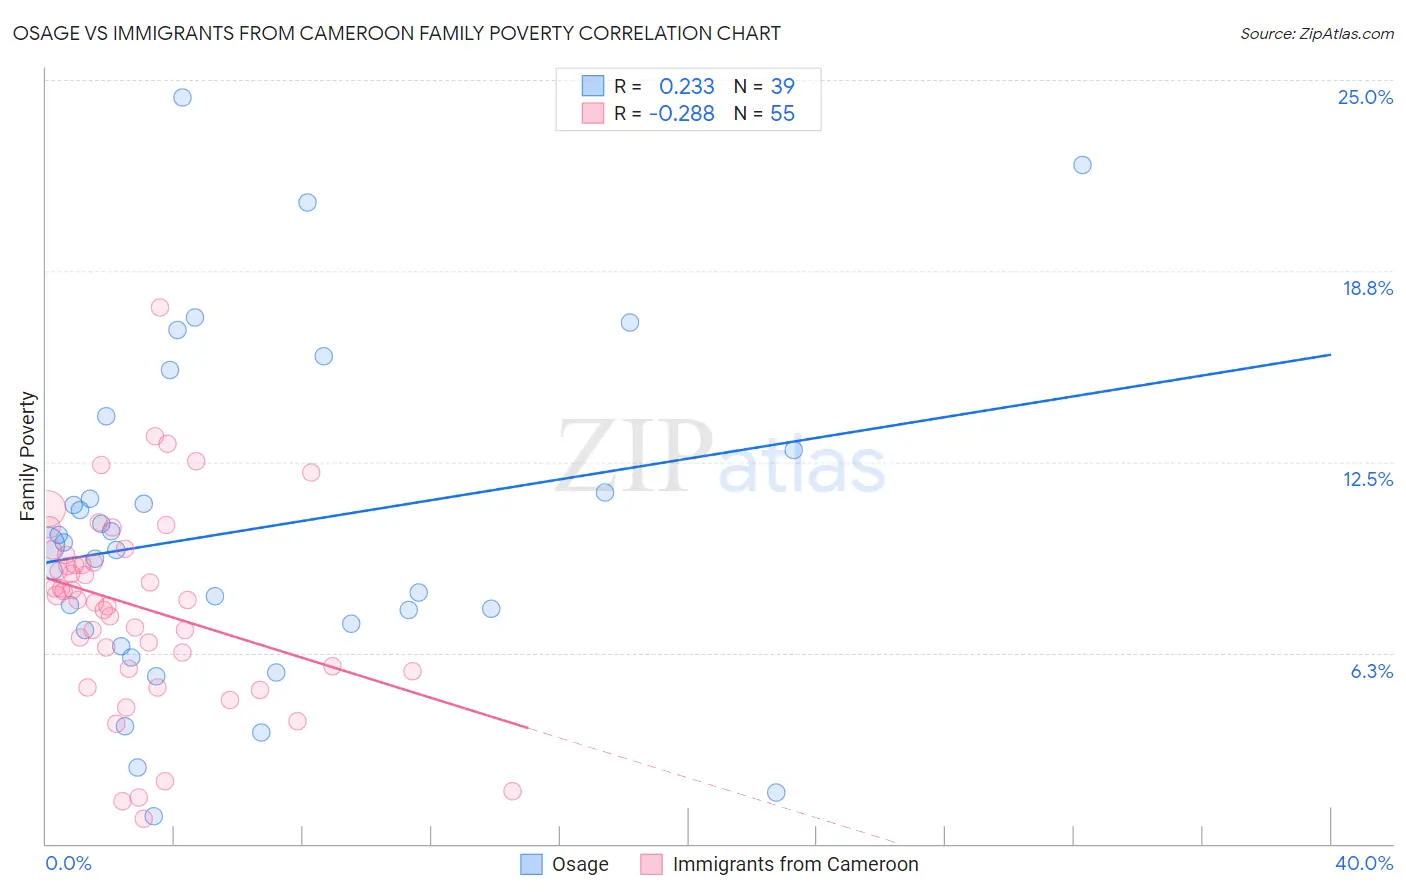
Osage vs Immigrants from Cameroon Family Poverty Correlation Chart
The statistical analysis conducted on geographies consisting of 91,772,722 people shows a weak positive correlation between the proportion of Osage and poverty level among families in the United States with a correlation coefficient (R) of 0.233 and weighted average of 9.7%. Similarly, the statistical analysis conducted on geographies consisting of 130,510,031 people shows a weak negative correlation between the proportion of Immigrants from Cameroon and poverty level among families in the United States with a correlation coefficient (R) of -0.288 and weighted average of 9.0%, a difference of 7.6%.
Family Poverty Correlation Summary
| Measurement | Osage | Immigrants from Cameroon |
| Minimum | 0.88% | 0.83% |
| Maximum | 24.4% | 17.5% |
| Range | 23.6% | 16.7% |
| Mean | 10.3% | 7.8% |
| Median | 9.8% | 8.0% |
| Interquartile 25% (IQ1) | 7.0% | 5.7% |
| Interquartile 75% (IQ3) | 12.9% | 9.5% |
| Interquartile Range (IQR) | 5.9% | 3.7% |
| Standard Deviation (Sample) | 5.4% | 3.2% |
| Standard Deviation (Population) | 5.4% | 3.2% |
Similar Demographics by Family Poverty
Demographics Similar to Osage by Family Poverty
In terms of family poverty, the demographic groups most similar to Osage are Immigrants from Micronesia (9.8%, a difference of 0.58%), Nonimmigrants (9.8%, a difference of 0.61%), Immigrants from Thailand (9.7%, a difference of 0.63%), Moroccan (9.8%, a difference of 0.67%), and American (9.8%, a difference of 0.87%).
| Demographics | Rating | Rank | Family Poverty |
| Immigrants | South America | 18.0 /100 | #206 | Poor 9.5% |
| Sierra Leoneans | 15.6 /100 | #207 | Poor 9.5% |
| Immigrants | Eastern Africa | 15.1 /100 | #208 | Poor 9.5% |
| Immigrants | Uruguay | 14.0 /100 | #209 | Poor 9.5% |
| Alsatians | 11.3 /100 | #210 | Poor 9.6% |
| Malaysians | 10.6 /100 | #211 | Poor 9.6% |
| Immigrants | Thailand | 9.7 /100 | #212 | Tragic 9.7% |
| Osage | 8.0 /100 | #213 | Tragic 9.7% |
| Immigrants | Micronesia | 6.7 /100 | #214 | Tragic 9.8% |
| Immigrants | Nonimmigrants | 6.7 /100 | #215 | Tragic 9.8% |
| Moroccans | 6.5 /100 | #216 | Tragic 9.8% |
| Americans | 6.2 /100 | #217 | Tragic 9.8% |
| Panamanians | 5.6 /100 | #218 | Tragic 9.8% |
| Immigrants | Eritrea | 5.4 /100 | #219 | Tragic 9.9% |
| Bermudans | 5.3 /100 | #220 | Tragic 9.9% |
Demographics Similar to Immigrants from Cameroon by Family Poverty
In terms of family poverty, the demographic groups most similar to Immigrants from Cameroon are Hawaiian (9.0%, a difference of 0.010%), Immigrants from Syria (9.0%, a difference of 0.040%), Costa Rican (9.0%, a difference of 0.28%), Immigrants from Iraq (9.1%, a difference of 0.36%), and Immigrants from Albania (9.0%, a difference of 0.37%).
| Demographics | Rating | Rank | Family Poverty |
| Lebanese | 57.6 /100 | #171 | Average 8.9% |
| Immigrants | Peru | 57.5 /100 | #172 | Average 8.9% |
| Immigrants | Fiji | 56.4 /100 | #173 | Average 8.9% |
| Immigrants | Albania | 50.0 /100 | #174 | Average 9.0% |
| Costa Ricans | 49.3 /100 | #175 | Average 9.0% |
| Immigrants | Syria | 47.5 /100 | #176 | Average 9.0% |
| Hawaiians | 47.2 /100 | #177 | Average 9.0% |
| Immigrants | Cameroon | 47.1 /100 | #178 | Average 9.0% |
| Immigrants | Iraq | 44.4 /100 | #179 | Average 9.1% |
| Immigrants | Uganda | 43.4 /100 | #180 | Average 9.1% |
| Hmong | 40.2 /100 | #181 | Average 9.1% |
| Immigrants | Morocco | 40.2 /100 | #182 | Average 9.1% |
| Uruguayans | 39.2 /100 | #183 | Fair 9.1% |
| South American Indians | 38.7 /100 | #184 | Fair 9.1% |
| Immigrants | Saudi Arabia | 38.6 /100 | #185 | Fair 9.1% |