Immigrants from Egypt vs Sudanese Family Poverty
COMPARE
Immigrants from Egypt
Sudanese
Family Poverty
Family Poverty Comparison
Immigrants from Egypt
Sudanese
8.3%
FAMILY POVERTY
91.6/ 100
METRIC RATING
120th/ 347
METRIC RANK
10.0%
FAMILY POVERTY
3.1/ 100
METRIC RATING
228th/ 347
METRIC RANK
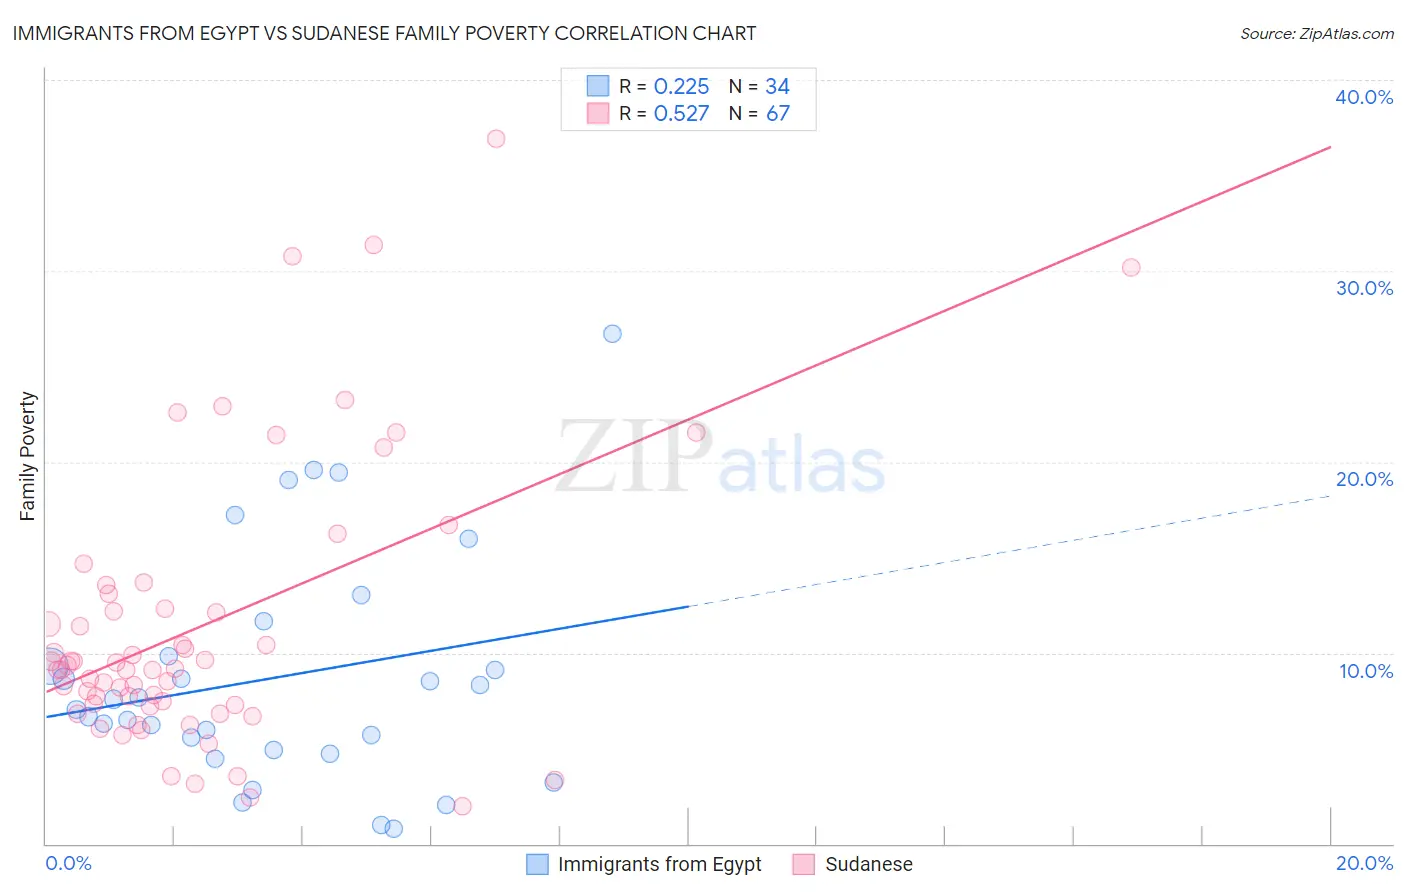
Immigrants from Egypt vs Sudanese Family Poverty Correlation Chart
The statistical analysis conducted on geographies consisting of 245,176,811 people shows a weak positive correlation between the proportion of Immigrants from Egypt and poverty level among families in the United States with a correlation coefficient (R) of 0.225 and weighted average of 8.3%. Similarly, the statistical analysis conducted on geographies consisting of 110,085,531 people shows a substantial positive correlation between the proportion of Sudanese and poverty level among families in the United States with a correlation coefficient (R) of 0.527 and weighted average of 10.0%, a difference of 20.7%.
Family Poverty Correlation Summary
| Measurement | Immigrants from Egypt | Sudanese |
| Minimum | 0.80% | 1.9% |
| Maximum | 26.7% | 36.9% |
| Range | 25.9% | 35.0% |
| Mean | 8.7% | 11.5% |
| Median | 7.3% | 9.2% |
| Interquartile 25% (IQ1) | 4.9% | 7.3% |
| Interquartile 75% (IQ3) | 9.8% | 13.1% |
| Interquartile Range (IQR) | 4.9% | 5.8% |
| Standard Deviation (Sample) | 6.0% | 7.3% |
| Standard Deviation (Population) | 5.9% | 7.3% |
Similar Demographics by Family Poverty
Demographics Similar to Immigrants from Egypt by Family Poverty
In terms of family poverty, the demographic groups most similar to Immigrants from Egypt are Native Hawaiian (8.3%, a difference of 0.17%), Paraguayan (8.3%, a difference of 0.18%), Palestinian (8.3%, a difference of 0.25%), Soviet Union (8.3%, a difference of 0.35%), and Pakistani (8.3%, a difference of 0.39%).
| Demographics | Rating | Rank | Family Poverty |
| Canadians | 94.2 /100 | #113 | Exceptional 8.2% |
| Immigrants | Zimbabwe | 94.0 /100 | #114 | Exceptional 8.2% |
| Immigrants | Israel | 93.5 /100 | #115 | Exceptional 8.2% |
| South Africans | 93.4 /100 | #116 | Exceptional 8.2% |
| Immigrants | Russia | 93.2 /100 | #117 | Exceptional 8.2% |
| Immigrants | Western Europe | 92.9 /100 | #118 | Exceptional 8.2% |
| French | 92.8 /100 | #119 | Exceptional 8.3% |
| Immigrants | Egypt | 91.6 /100 | #120 | Exceptional 8.3% |
| Native Hawaiians | 91.3 /100 | #121 | Exceptional 8.3% |
| Paraguayans | 91.2 /100 | #122 | Exceptional 8.3% |
| Palestinians | 91.1 /100 | #123 | Exceptional 8.3% |
| Soviet Union | 90.8 /100 | #124 | Exceptional 8.3% |
| Pakistanis | 90.8 /100 | #125 | Exceptional 8.3% |
| Icelanders | 90.3 /100 | #126 | Exceptional 8.3% |
| Immigrants | Hungary | 89.9 /100 | #127 | Excellent 8.4% |
Demographics Similar to Sudanese by Family Poverty
In terms of family poverty, the demographic groups most similar to Sudanese are Immigrants from Uzbekistan (10.0%, a difference of 0.010%), Immigrants from Panama (10.0%, a difference of 0.030%), Immigrants from Armenia (10.0%, a difference of 0.20%), Ottawa (10.0%, a difference of 0.22%), and Alaskan Athabascan (10.1%, a difference of 0.41%).
| Demographics | Rating | Rank | Family Poverty |
| Immigrants | Cambodia | 4.8 /100 | #221 | Tragic 9.9% |
| Japanese | 4.8 /100 | #222 | Tragic 9.9% |
| Immigrants | Africa | 4.3 /100 | #223 | Tragic 9.9% |
| Marshallese | 3.9 /100 | #224 | Tragic 9.9% |
| Immigrants | Immigrants | 3.6 /100 | #225 | Tragic 10.0% |
| Ottawa | 3.3 /100 | #226 | Tragic 10.0% |
| Immigrants | Armenia | 3.3 /100 | #227 | Tragic 10.0% |
| Sudanese | 3.1 /100 | #228 | Tragic 10.0% |
| Immigrants | Uzbekistan | 3.1 /100 | #229 | Tragic 10.0% |
| Immigrants | Panama | 3.1 /100 | #230 | Tragic 10.0% |
| Alaskan Athabascans | 2.7 /100 | #231 | Tragic 10.1% |
| Immigrants | Sudan | 2.3 /100 | #232 | Tragic 10.1% |
| Fijians | 2.1 /100 | #233 | Tragic 10.1% |
| Immigrants | Middle Africa | 2.1 /100 | #234 | Tragic 10.1% |
| Nigerians | 2.0 /100 | #235 | Tragic 10.1% |