Osage vs Asian Family Poverty
COMPARE
Osage
Asian
Family Poverty
Family Poverty Comparison
Osage
Asians
9.7%
FAMILY POVERTY
8.0/ 100
METRIC RATING
213th/ 347
METRIC RANK
7.7%
FAMILY POVERTY
98.7/ 100
METRIC RATING
57th/ 347
METRIC RANK
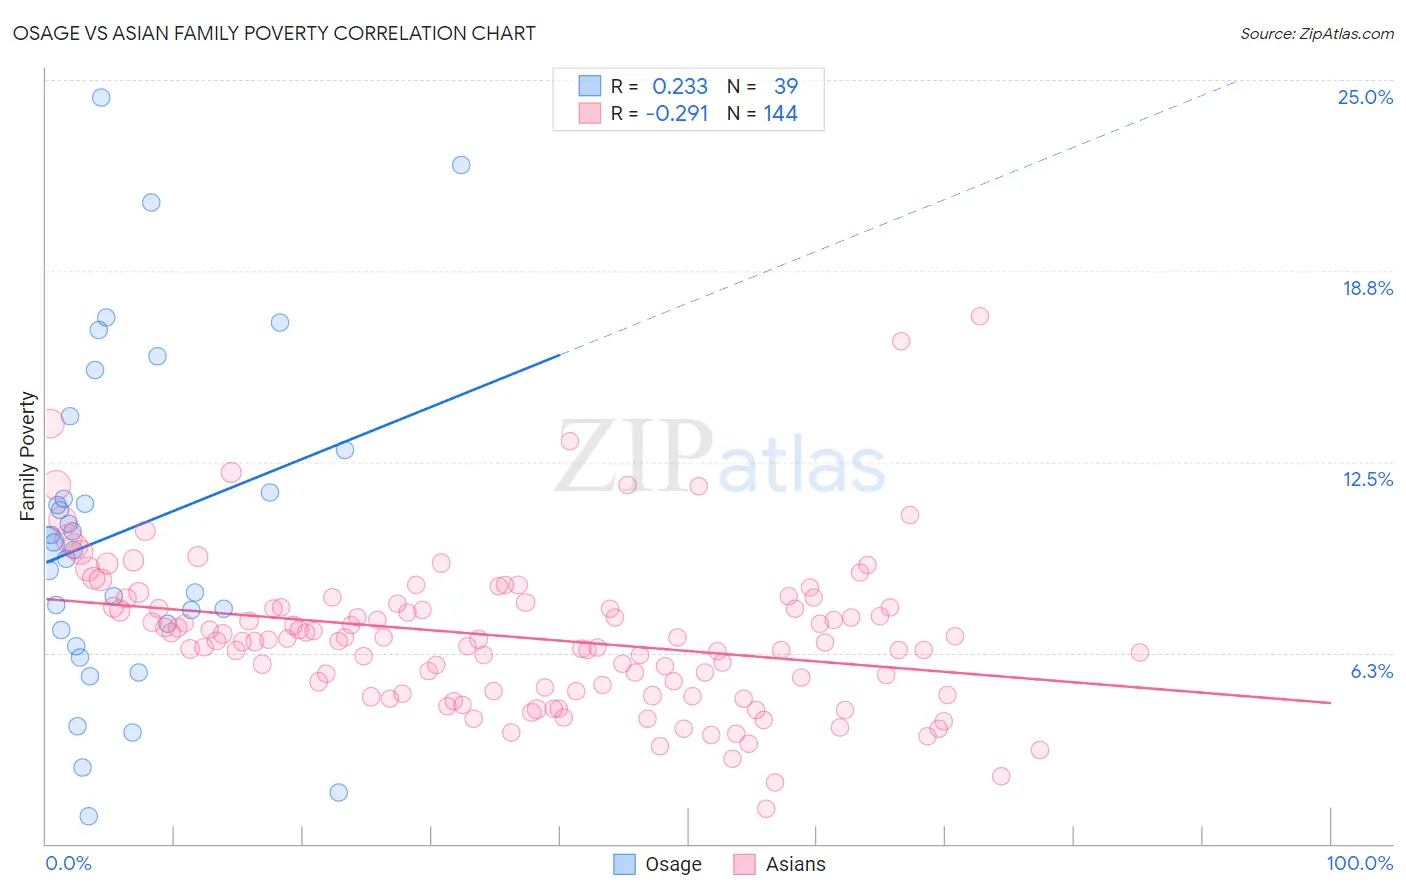
Osage vs Asian Family Poverty Correlation Chart
The statistical analysis conducted on geographies consisting of 91,772,722 people shows a weak positive correlation between the proportion of Osage and poverty level among families in the United States with a correlation coefficient (R) of 0.233 and weighted average of 9.7%. Similarly, the statistical analysis conducted on geographies consisting of 547,164,240 people shows a weak negative correlation between the proportion of Asians and poverty level among families in the United States with a correlation coefficient (R) of -0.291 and weighted average of 7.7%, a difference of 25.8%.
Family Poverty Correlation Summary
| Measurement | Osage | Asian |
| Minimum | 0.88% | 1.2% |
| Maximum | 24.4% | 17.3% |
| Range | 23.6% | 16.1% |
| Mean | 10.3% | 6.8% |
| Median | 9.8% | 6.7% |
| Interquartile 25% (IQ1) | 7.0% | 5.0% |
| Interquartile 75% (IQ3) | 12.9% | 7.7% |
| Interquartile Range (IQR) | 5.9% | 2.7% |
| Standard Deviation (Sample) | 5.4% | 2.5% |
| Standard Deviation (Population) | 5.4% | 2.5% |
Similar Demographics by Family Poverty
Demographics Similar to Osage by Family Poverty
In terms of family poverty, the demographic groups most similar to Osage are Immigrants from Micronesia (9.8%, a difference of 0.58%), Nonimmigrants (9.8%, a difference of 0.61%), Immigrants from Thailand (9.7%, a difference of 0.63%), Moroccan (9.8%, a difference of 0.67%), and American (9.8%, a difference of 0.87%).
| Demographics | Rating | Rank | Family Poverty |
| Immigrants | South America | 18.0 /100 | #206 | Poor 9.5% |
| Sierra Leoneans | 15.6 /100 | #207 | Poor 9.5% |
| Immigrants | Eastern Africa | 15.1 /100 | #208 | Poor 9.5% |
| Immigrants | Uruguay | 14.0 /100 | #209 | Poor 9.5% |
| Alsatians | 11.3 /100 | #210 | Poor 9.6% |
| Malaysians | 10.6 /100 | #211 | Poor 9.6% |
| Immigrants | Thailand | 9.7 /100 | #212 | Tragic 9.7% |
| Osage | 8.0 /100 | #213 | Tragic 9.7% |
| Immigrants | Micronesia | 6.7 /100 | #214 | Tragic 9.8% |
| Immigrants | Nonimmigrants | 6.7 /100 | #215 | Tragic 9.8% |
| Moroccans | 6.5 /100 | #216 | Tragic 9.8% |
| Americans | 6.2 /100 | #217 | Tragic 9.8% |
| Panamanians | 5.6 /100 | #218 | Tragic 9.8% |
| Immigrants | Eritrea | 5.4 /100 | #219 | Tragic 9.9% |
| Bermudans | 5.3 /100 | #220 | Tragic 9.9% |
Demographics Similar to Asians by Family Poverty
In terms of family poverty, the demographic groups most similar to Asians are Finnish (7.7%, a difference of 0.030%), European (7.7%, a difference of 0.040%), Immigrants from Greece (7.7%, a difference of 0.050%), Immigrants from Serbia (7.7%, a difference of 0.090%), and Immigrants from Eastern Asia (7.7%, a difference of 0.13%).
| Demographics | Rating | Rank | Family Poverty |
| Immigrants | North Macedonia | 98.9 /100 | #50 | Exceptional 7.7% |
| Immigrants | Moldova | 98.8 /100 | #51 | Exceptional 7.7% |
| Indians (Asian) | 98.8 /100 | #52 | Exceptional 7.7% |
| Swiss | 98.8 /100 | #53 | Exceptional 7.7% |
| Immigrants | Sweden | 98.8 /100 | #54 | Exceptional 7.7% |
| Immigrants | Eastern Asia | 98.7 /100 | #55 | Exceptional 7.7% |
| Immigrants | Serbia | 98.7 /100 | #56 | Exceptional 7.7% |
| Asians | 98.7 /100 | #57 | Exceptional 7.7% |
| Finns | 98.7 /100 | #58 | Exceptional 7.7% |
| Europeans | 98.7 /100 | #59 | Exceptional 7.7% |
| Immigrants | Greece | 98.7 /100 | #60 | Exceptional 7.7% |
| Immigrants | Netherlands | 98.6 /100 | #61 | Exceptional 7.7% |
| Macedonians | 98.6 /100 | #62 | Exceptional 7.8% |
| Zimbabweans | 98.4 /100 | #63 | Exceptional 7.8% |
| Koreans | 98.3 /100 | #64 | Exceptional 7.8% |