Osage vs Immigrants from Peru Male Poverty
COMPARE
Osage
Immigrants from Peru
Male Poverty
Male Poverty Comparison
Osage
Immigrants from Peru
12.3%
MALE POVERTY
1.5/ 100
METRIC RATING
225th/ 347
METRIC RANK
10.7%
MALE POVERTY
84.1/ 100
METRIC RATING
129th/ 347
METRIC RANK
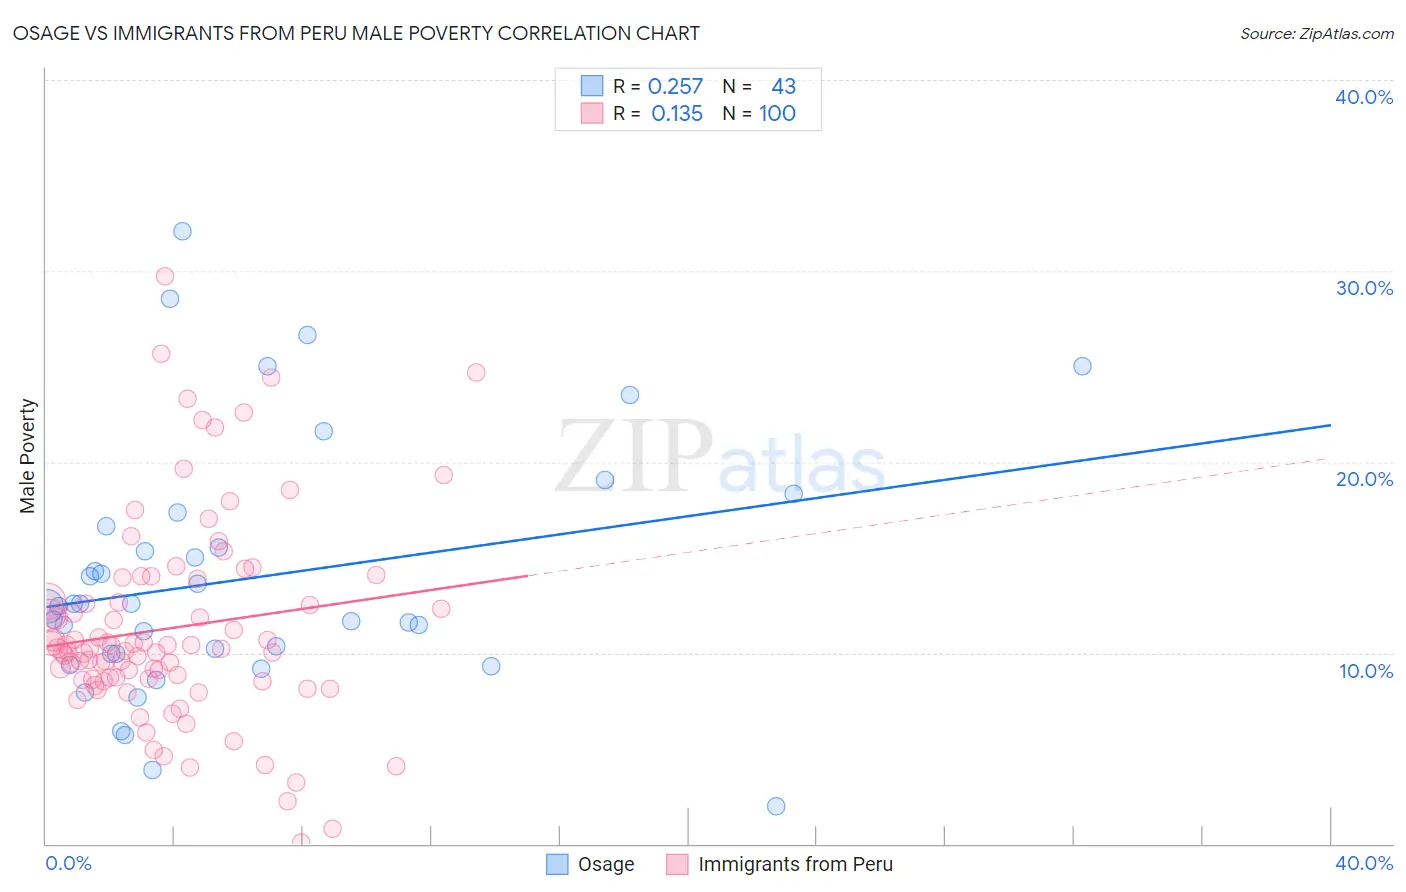
Osage vs Immigrants from Peru Male Poverty Correlation Chart
The statistical analysis conducted on geographies consisting of 91,789,808 people shows a weak positive correlation between the proportion of Osage and poverty level among males in the United States with a correlation coefficient (R) of 0.257 and weighted average of 12.3%. Similarly, the statistical analysis conducted on geographies consisting of 328,672,815 people shows a poor positive correlation between the proportion of Immigrants from Peru and poverty level among males in the United States with a correlation coefficient (R) of 0.135 and weighted average of 10.7%, a difference of 14.9%.
Male Poverty Correlation Summary
| Measurement | Osage | Immigrants from Peru |
| Minimum | 1.9% | 0.066% |
| Maximum | 32.1% | 29.7% |
| Range | 30.2% | 29.6% |
| Mean | 13.9% | 11.3% |
| Median | 12.4% | 10.2% |
| Interquartile 25% (IQ1) | 9.9% | 8.6% |
| Interquartile 75% (IQ3) | 16.6% | 13.3% |
| Interquartile Range (IQR) | 6.7% | 4.7% |
| Standard Deviation (Sample) | 6.6% | 5.3% |
| Standard Deviation (Population) | 6.5% | 5.3% |
Similar Demographics by Male Poverty
Demographics Similar to Osage by Male Poverty
In terms of male poverty, the demographic groups most similar to Osage are Immigrants from Nigeria (12.3%, a difference of 0.060%), Nigerian (12.3%, a difference of 0.17%), Alaska Native (12.4%, a difference of 0.26%), Alsatian (12.4%, a difference of 0.30%), and Cuban (12.4%, a difference of 0.39%).
| Demographics | Rating | Rank | Male Poverty |
| German Russians | 2.5 /100 | #218 | Tragic 12.2% |
| Bermudans | 2.4 /100 | #219 | Tragic 12.2% |
| Immigrants | Eritrea | 2.4 /100 | #220 | Tragic 12.2% |
| Ugandans | 2.2 /100 | #221 | Tragic 12.2% |
| Immigrants | Africa | 2.1 /100 | #222 | Tragic 12.2% |
| Immigrants | Micronesia | 2.1 /100 | #223 | Tragic 12.2% |
| Immigrants | Nigeria | 1.6 /100 | #224 | Tragic 12.3% |
| Osage | 1.5 /100 | #225 | Tragic 12.3% |
| Nigerians | 1.4 /100 | #226 | Tragic 12.3% |
| Alaska Natives | 1.4 /100 | #227 | Tragic 12.4% |
| Alsatians | 1.3 /100 | #228 | Tragic 12.4% |
| Cubans | 1.3 /100 | #229 | Tragic 12.4% |
| Marshallese | 0.8 /100 | #230 | Tragic 12.5% |
| Salvadorans | 0.6 /100 | #231 | Tragic 12.6% |
| Nicaraguans | 0.6 /100 | #232 | Tragic 12.6% |
Demographics Similar to Immigrants from Peru by Male Poverty
In terms of male poverty, the demographic groups most similar to Immigrants from Peru are Immigrants from Western Europe (10.7%, a difference of 0.010%), Immigrants from Ukraine (10.7%, a difference of 0.030%), Puget Sound Salish (10.7%, a difference of 0.030%), Chilean (10.7%, a difference of 0.050%), and Immigrants from Belarus (10.7%, a difference of 0.15%).
| Demographics | Rating | Rank | Male Poverty |
| Native Hawaiians | 87.0 /100 | #122 | Excellent 10.7% |
| South Africans | 86.8 /100 | #123 | Excellent 10.7% |
| French | 86.7 /100 | #124 | Excellent 10.7% |
| Immigrants | Norway | 86.0 /100 | #125 | Excellent 10.7% |
| Immigrants | Ukraine | 84.3 /100 | #126 | Excellent 10.7% |
| Puget Sound Salish | 84.3 /100 | #127 | Excellent 10.7% |
| Immigrants | Western Europe | 84.2 /100 | #128 | Excellent 10.7% |
| Immigrants | Peru | 84.1 /100 | #129 | Excellent 10.7% |
| Chileans | 83.9 /100 | #130 | Excellent 10.7% |
| Immigrants | Belarus | 83.3 /100 | #131 | Excellent 10.7% |
| Immigrants | Vietnam | 83.0 /100 | #132 | Excellent 10.8% |
| Pakistanis | 83.0 /100 | #133 | Excellent 10.8% |
| New Zealanders | 82.9 /100 | #134 | Excellent 10.8% |
| Brazilians | 82.7 /100 | #135 | Excellent 10.8% |
| Immigrants | Israel | 80.9 /100 | #136 | Excellent 10.8% |