Osage vs Immigrants from Sudan Average Family Size
COMPARE
Osage
Immigrants from Sudan
Average Family Size
Average Family Size Comparison
Osage
Immigrants from Sudan
3.18
AVERAGE FAMILY SIZE
3.2/ 100
METRIC RATING
240th/ 347
METRIC RANK
3.22
AVERAGE FAMILY SIZE
29.1/ 100
METRIC RATING
194th/ 347
METRIC RANK
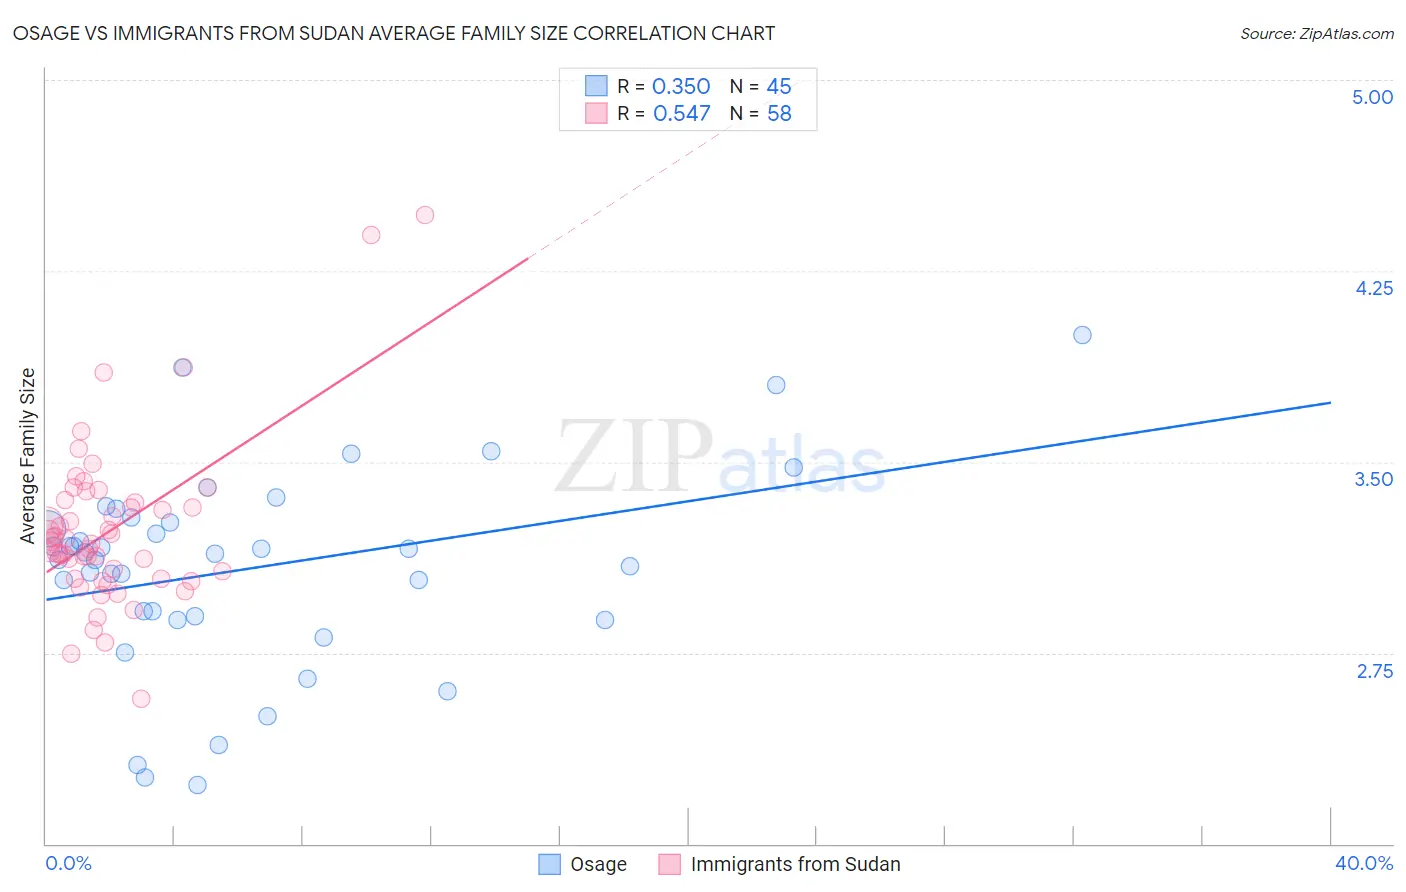
Osage vs Immigrants from Sudan Average Family Size Correlation Chart
The statistical analysis conducted on geographies consisting of 91,797,548 people shows a mild positive correlation between the proportion of Osage and average family size in the United States with a correlation coefficient (R) of 0.350 and weighted average of 3.18. Similarly, the statistical analysis conducted on geographies consisting of 118,946,972 people shows a substantial positive correlation between the proportion of Immigrants from Sudan and average family size in the United States with a correlation coefficient (R) of 0.547 and weighted average of 3.22, a difference of 1.2%.
Average Family Size Correlation Summary
| Measurement | Osage | Immigrants from Sudan |
| Minimum | 2.23 | 2.57 |
| Maximum | 4.00 | 4.47 |
| Range | 1.77 | 1.90 |
| Mean | 3.08 | 3.23 |
| Median | 3.14 | 3.18 |
| Interquartile 25% (IQ1) | 2.89 | 3.04 |
| Interquartile 75% (IQ3) | 3.27 | 3.34 |
| Interquartile Range (IQR) | 0.38 | 0.30 |
| Standard Deviation (Sample) | 0.39 | 0.33 |
| Standard Deviation (Population) | 0.38 | 0.32 |
Similar Demographics by Average Family Size
Demographics Similar to Osage by Average Family Size
In terms of average family size, the demographic groups most similar to Osage are Houma (3.18, a difference of 0.020%), Immigrants from Japan (3.18, a difference of 0.020%), Hungarian (3.18, a difference of 0.040%), Immigrants from Moldova (3.18, a difference of 0.040%), and Immigrants from Southern Europe (3.18, a difference of 0.050%).
| Demographics | Rating | Rank | Average Family Size |
| Brazilians | 4.5 /100 | #233 | Tragic 3.18 |
| Iranians | 4.5 /100 | #234 | Tragic 3.18 |
| Immigrants | Turkey | 4.2 /100 | #235 | Tragic 3.18 |
| Immigrants | Portugal | 4.2 /100 | #236 | Tragic 3.18 |
| Immigrants | Romania | 3.7 /100 | #237 | Tragic 3.18 |
| Romanians | 3.7 /100 | #238 | Tragic 3.18 |
| Houma | 3.4 /100 | #239 | Tragic 3.18 |
| Osage | 3.2 /100 | #240 | Tragic 3.18 |
| Immigrants | Japan | 3.0 /100 | #241 | Tragic 3.18 |
| Hungarians | 3.0 /100 | #242 | Tragic 3.18 |
| Immigrants | Moldova | 2.9 /100 | #243 | Tragic 3.18 |
| Immigrants | Southern Europe | 2.9 /100 | #244 | Tragic 3.18 |
| Immigrants | Brazil | 2.7 /100 | #245 | Tragic 3.18 |
| Danes | 2.5 /100 | #246 | Tragic 3.17 |
| Cajuns | 2.4 /100 | #247 | Tragic 3.17 |
Demographics Similar to Immigrants from Sudan by Average Family Size
In terms of average family size, the demographic groups most similar to Immigrants from Sudan are Immigrants from Israel (3.22, a difference of 0.0%), Immigrants from Eastern Africa (3.22, a difference of 0.020%), Choctaw (3.21, a difference of 0.020%), Senegalese (3.21, a difference of 0.020%), and Kenyan (3.21, a difference of 0.020%).
| Demographics | Rating | Rank | Average Family Size |
| Immigrants | Malaysia | 39.0 /100 | #187 | Fair 3.22 |
| Thais | 38.3 /100 | #188 | Fair 3.22 |
| Pakistanis | 33.7 /100 | #189 | Fair 3.22 |
| Burmese | 31.0 /100 | #190 | Fair 3.22 |
| Immigrants | Zaire | 30.5 /100 | #191 | Fair 3.22 |
| Immigrants | Eastern Africa | 30.1 /100 | #192 | Fair 3.22 |
| Immigrants | Israel | 29.3 /100 | #193 | Fair 3.22 |
| Immigrants | Sudan | 29.1 /100 | #194 | Fair 3.22 |
| Choctaw | 28.3 /100 | #195 | Fair 3.21 |
| Senegalese | 28.2 /100 | #196 | Fair 3.21 |
| Kenyans | 28.0 /100 | #197 | Fair 3.21 |
| Immigrants | Azores | 21.7 /100 | #198 | Fair 3.21 |
| Hmong | 20.7 /100 | #199 | Fair 3.21 |
| Immigrants | Kenya | 19.2 /100 | #200 | Poor 3.21 |
| Immigrants | Morocco | 18.5 /100 | #201 | Poor 3.21 |