Osage vs Immigrants from Sudan Currently Married
COMPARE
Osage
Immigrants from Sudan
Currently Married
Currently Married Comparison
Osage
Immigrants from Sudan
47.5%
CURRENTLY MARRIED
87.9/ 100
METRIC RATING
122nd/ 347
METRIC RANK
43.5%
CURRENTLY MARRIED
0.1/ 100
METRIC RATING
269th/ 347
METRIC RANK
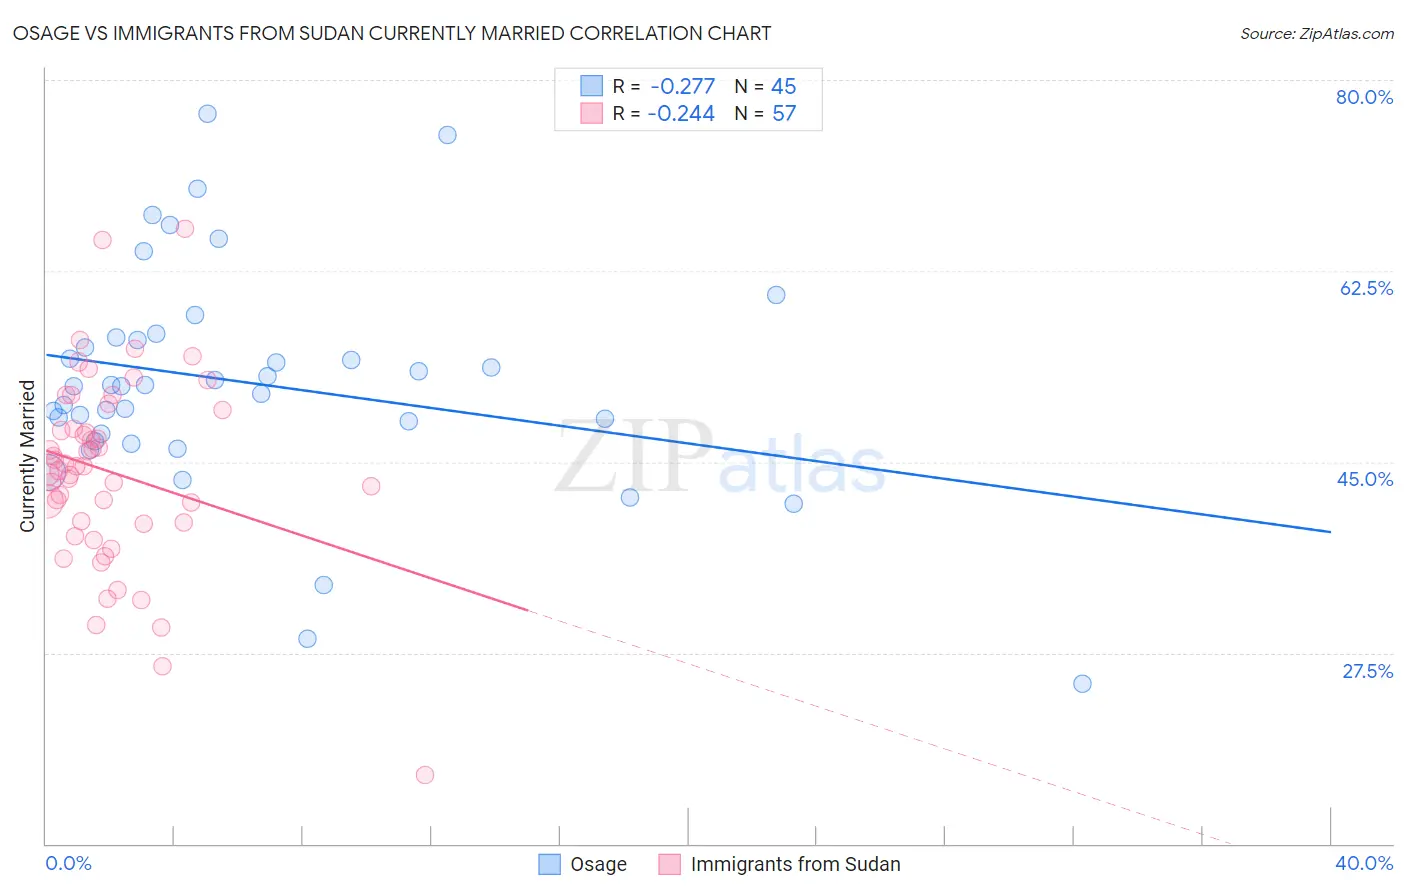
Osage vs Immigrants from Sudan Currently Married Correlation Chart
The statistical analysis conducted on geographies consisting of 91,806,752 people shows a weak negative correlation between the proportion of Osage and percentage of population currently married in the United States with a correlation coefficient (R) of -0.277 and weighted average of 47.5%. Similarly, the statistical analysis conducted on geographies consisting of 118,963,461 people shows a weak negative correlation between the proportion of Immigrants from Sudan and percentage of population currently married in the United States with a correlation coefficient (R) of -0.244 and weighted average of 43.5%, a difference of 9.1%.
Currently Married Correlation Summary
| Measurement | Osage | Immigrants from Sudan |
| Minimum | 24.7% | 16.3% |
| Maximum | 76.9% | 66.4% |
| Range | 52.2% | 50.1% |
| Mean | 52.2% | 44.1% |
| Median | 51.9% | 44.6% |
| Interquartile 25% (IQ1) | 47.2% | 39.4% |
| Interquartile 75% (IQ3) | 56.3% | 48.9% |
| Interquartile Range (IQR) | 9.1% | 9.6% |
| Standard Deviation (Sample) | 10.3% | 8.8% |
| Standard Deviation (Population) | 10.2% | 8.7% |
Similar Demographics by Currently Married
Demographics Similar to Osage by Currently Married
In terms of currently married, the demographic groups most similar to Osage are Immigrants from Croatia (47.5%, a difference of 0.060%), Immigrants from Kazakhstan (47.4%, a difference of 0.060%), Syrian (47.5%, a difference of 0.090%), Laotian (47.4%, a difference of 0.11%), and Okinawan (47.4%, a difference of 0.20%).
| Demographics | Rating | Rank | Currently Married |
| Immigrants | Indonesia | 90.5 /100 | #115 | Exceptional 47.6% |
| Palestinians | 90.4 /100 | #116 | Exceptional 47.6% |
| Puget Sound Salish | 90.3 /100 | #117 | Exceptional 47.6% |
| Immigrants | Philippines | 90.2 /100 | #118 | Exceptional 47.6% |
| Australians | 90.2 /100 | #119 | Exceptional 47.6% |
| Syrians | 88.9 /100 | #120 | Excellent 47.5% |
| Immigrants | Croatia | 88.6 /100 | #121 | Excellent 47.5% |
| Osage | 87.9 /100 | #122 | Excellent 47.5% |
| Immigrants | Kazakhstan | 87.2 /100 | #123 | Excellent 47.4% |
| Laotians | 86.6 /100 | #124 | Excellent 47.4% |
| Okinawans | 85.3 /100 | #125 | Excellent 47.4% |
| Immigrants | Jordan | 84.9 /100 | #126 | Excellent 47.4% |
| New Zealanders | 84.9 /100 | #127 | Excellent 47.4% |
| Portuguese | 84.2 /100 | #128 | Excellent 47.3% |
| Sri Lankans | 83.2 /100 | #129 | Excellent 47.3% |
Demographics Similar to Immigrants from Sudan by Currently Married
In terms of currently married, the demographic groups most similar to Immigrants from Sudan are Salvadoran (43.5%, a difference of 0.080%), Bermudan (43.5%, a difference of 0.090%), Spanish American Indian (43.6%, a difference of 0.12%), Immigrants from Eritrea (43.6%, a difference of 0.13%), and Indonesian (43.5%, a difference of 0.13%).
| Demographics | Rating | Rank | Currently Married |
| Bangladeshis | 0.1 /100 | #262 | Tragic 43.7% |
| Immigrants | Cuba | 0.1 /100 | #263 | Tragic 43.7% |
| Sudanese | 0.1 /100 | #264 | Tragic 43.7% |
| Immigrants | Bangladesh | 0.1 /100 | #265 | Tragic 43.6% |
| Ecuadorians | 0.1 /100 | #266 | Tragic 43.6% |
| Immigrants | Eritrea | 0.1 /100 | #267 | Tragic 43.6% |
| Spanish American Indians | 0.1 /100 | #268 | Tragic 43.6% |
| Immigrants | Sudan | 0.1 /100 | #269 | Tragic 43.5% |
| Salvadorans | 0.1 /100 | #270 | Tragic 43.5% |
| Bermudans | 0.1 /100 | #271 | Tragic 43.5% |
| Indonesians | 0.1 /100 | #272 | Tragic 43.5% |
| Yaqui | 0.1 /100 | #273 | Tragic 43.4% |
| Nigerians | 0.1 /100 | #274 | Tragic 43.4% |
| Colville | 0.1 /100 | #275 | Tragic 43.4% |
| Sierra Leoneans | 0.1 /100 | #276 | Tragic 43.4% |