Nonimmigrants vs Greek Single Male Poverty
COMPARE
Nonimmigrants
Greek
Single Male Poverty
Single Male Poverty Comparison
Nonimmigrants
Greeks
14.6%
SINGLE MALE POVERTY
0.0/ 100
METRIC RATING
292nd/ 347
METRIC RANK
12.7%
SINGLE MALE POVERTY
64.1/ 100
METRIC RATING
160th/ 347
METRIC RANK
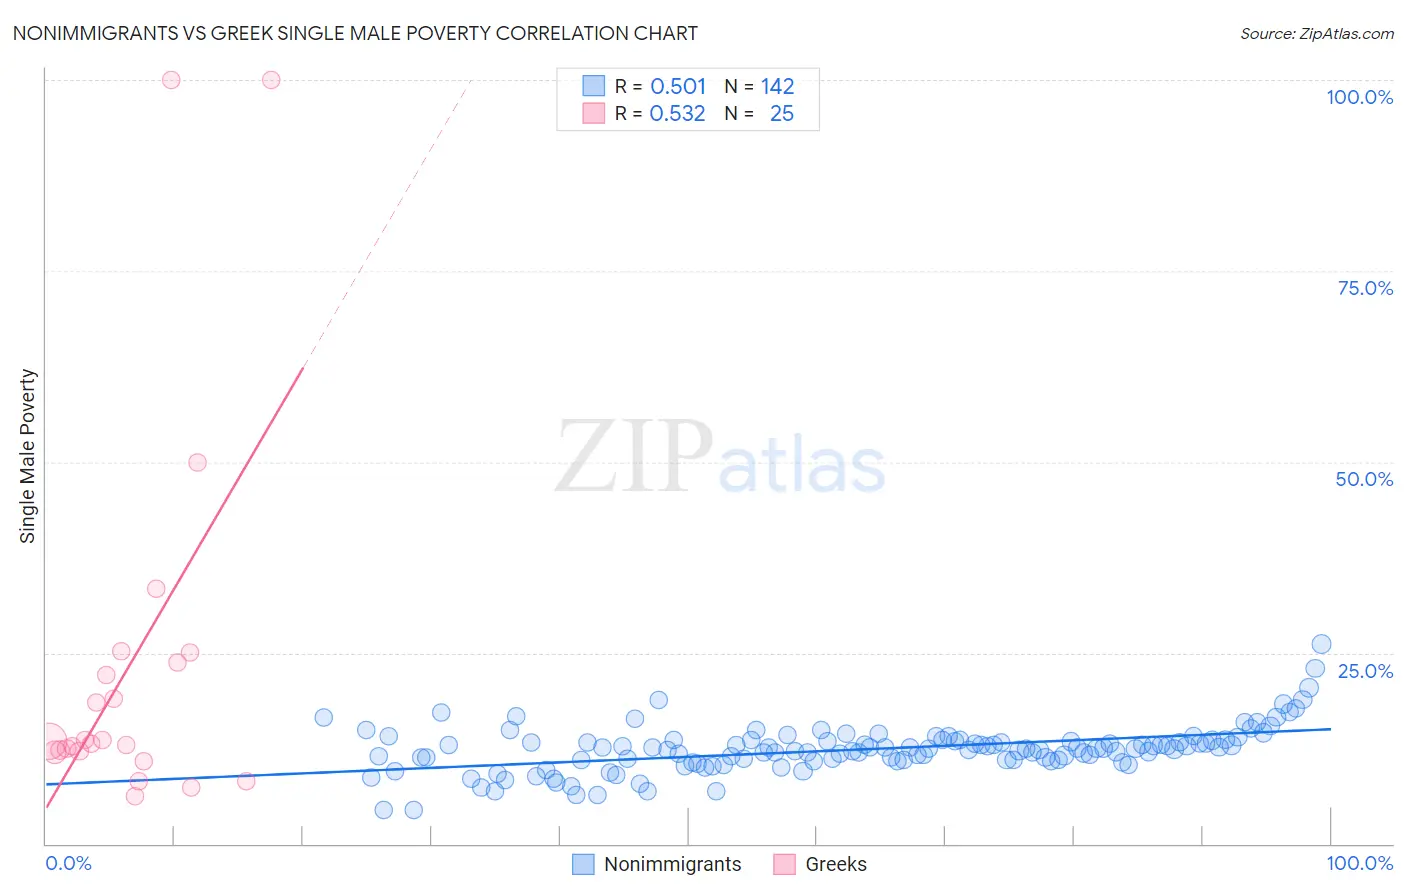
Nonimmigrants vs Greek Single Male Poverty Correlation Chart
The statistical analysis conducted on geographies consisting of 470,347,723 people shows a substantial positive correlation between the proportion of Nonimmigrants and poverty level among single males in the United States with a correlation coefficient (R) of 0.501 and weighted average of 14.6%. Similarly, the statistical analysis conducted on geographies consisting of 412,862,309 people shows a substantial positive correlation between the proportion of Greeks and poverty level among single males in the United States with a correlation coefficient (R) of 0.532 and weighted average of 12.7%, a difference of 14.7%.
Single Male Poverty Correlation Summary
| Measurement | Nonimmigrants | Greek |
| Minimum | 4.4% | 6.2% |
| Maximum | 26.2% | 100.0% |
| Range | 21.8% | 93.8% |
| Mean | 12.4% | 23.4% |
| Median | 12.5% | 13.4% |
| Interquartile 25% (IQ1) | 11.0% | 12.1% |
| Interquartile 75% (IQ3) | 13.5% | 24.4% |
| Interquartile Range (IQR) | 2.5% | 12.3% |
| Standard Deviation (Sample) | 3.1% | 24.9% |
| Standard Deviation (Population) | 3.1% | 24.4% |
Similar Demographics by Single Male Poverty
Demographics Similar to Nonimmigrants by Single Male Poverty
In terms of single male poverty, the demographic groups most similar to Nonimmigrants are French Canadian (14.6%, a difference of 0.11%), Bahamian (14.6%, a difference of 0.13%), U.S. Virgin Islander (14.5%, a difference of 0.28%), Ottawa (14.6%, a difference of 0.30%), and Immigrants from Dominica (14.5%, a difference of 0.51%).
| Demographics | Rating | Rank | Single Male Poverty |
| French | 0.0 /100 | #285 | Tragic 14.4% |
| Celtics | 0.0 /100 | #286 | Tragic 14.5% |
| Iroquois | 0.0 /100 | #287 | Tragic 14.5% |
| Whites/Caucasians | 0.0 /100 | #288 | Tragic 14.5% |
| Immigrants | Dominica | 0.0 /100 | #289 | Tragic 14.5% |
| U.S. Virgin Islanders | 0.0 /100 | #290 | Tragic 14.5% |
| Bahamians | 0.0 /100 | #291 | Tragic 14.6% |
| Immigrants | Nonimmigrants | 0.0 /100 | #292 | Tragic 14.6% |
| French Canadians | 0.0 /100 | #293 | Tragic 14.6% |
| Ottawa | 0.0 /100 | #294 | Tragic 14.6% |
| Scotch-Irish | 0.0 /100 | #295 | Tragic 14.7% |
| Africans | 0.0 /100 | #296 | Tragic 14.7% |
| Immigrants | Dominican Republic | 0.0 /100 | #297 | Tragic 14.8% |
| French American Indians | 0.0 /100 | #298 | Tragic 15.0% |
| Delaware | 0.0 /100 | #299 | Tragic 15.0% |
Demographics Similar to Greeks by Single Male Poverty
In terms of single male poverty, the demographic groups most similar to Greeks are Immigrants from Liberia (12.7%, a difference of 0.0%), Immigrants from Middle Africa (12.7%, a difference of 0.040%), Immigrants from Africa (12.7%, a difference of 0.040%), Eastern European (12.7%, a difference of 0.050%), and Palestinian (12.7%, a difference of 0.060%).
| Demographics | Rating | Rank | Single Male Poverty |
| Immigrants | Immigrants | 70.1 /100 | #153 | Good 12.7% |
| Immigrants | Scotland | 68.9 /100 | #154 | Good 12.7% |
| Immigrants | Spain | 68.7 /100 | #155 | Good 12.7% |
| Vietnamese | 67.9 /100 | #156 | Good 12.7% |
| Latvians | 67.9 /100 | #157 | Good 12.7% |
| Immigrants | Middle Africa | 64.9 /100 | #158 | Good 12.7% |
| Immigrants | Liberia | 64.2 /100 | #159 | Good 12.7% |
| Greeks | 64.1 /100 | #160 | Good 12.7% |
| Immigrants | Africa | 63.4 /100 | #161 | Good 12.7% |
| Eastern Europeans | 63.3 /100 | #162 | Good 12.7% |
| Palestinians | 63.1 /100 | #163 | Good 12.7% |
| Immigrants | Nigeria | 62.8 /100 | #164 | Good 12.7% |
| Immigrants | Cambodia | 62.2 /100 | #165 | Good 12.7% |
| Immigrants | Guyana | 60.5 /100 | #166 | Good 12.7% |
| Immigrants | Sudan | 58.2 /100 | #167 | Average 12.7% |