Nonimmigrants vs Navajo Hearing Disability
COMPARE
Nonimmigrants
Navajo
Hearing Disability
Hearing Disability Comparison
Nonimmigrants
Navajo
3.6%
HEARING DISABILITY
0.0/ 100
METRIC RATING
277th/ 347
METRIC RANK
4.6%
HEARING DISABILITY
0.0/ 100
METRIC RATING
341st/ 347
METRIC RANK
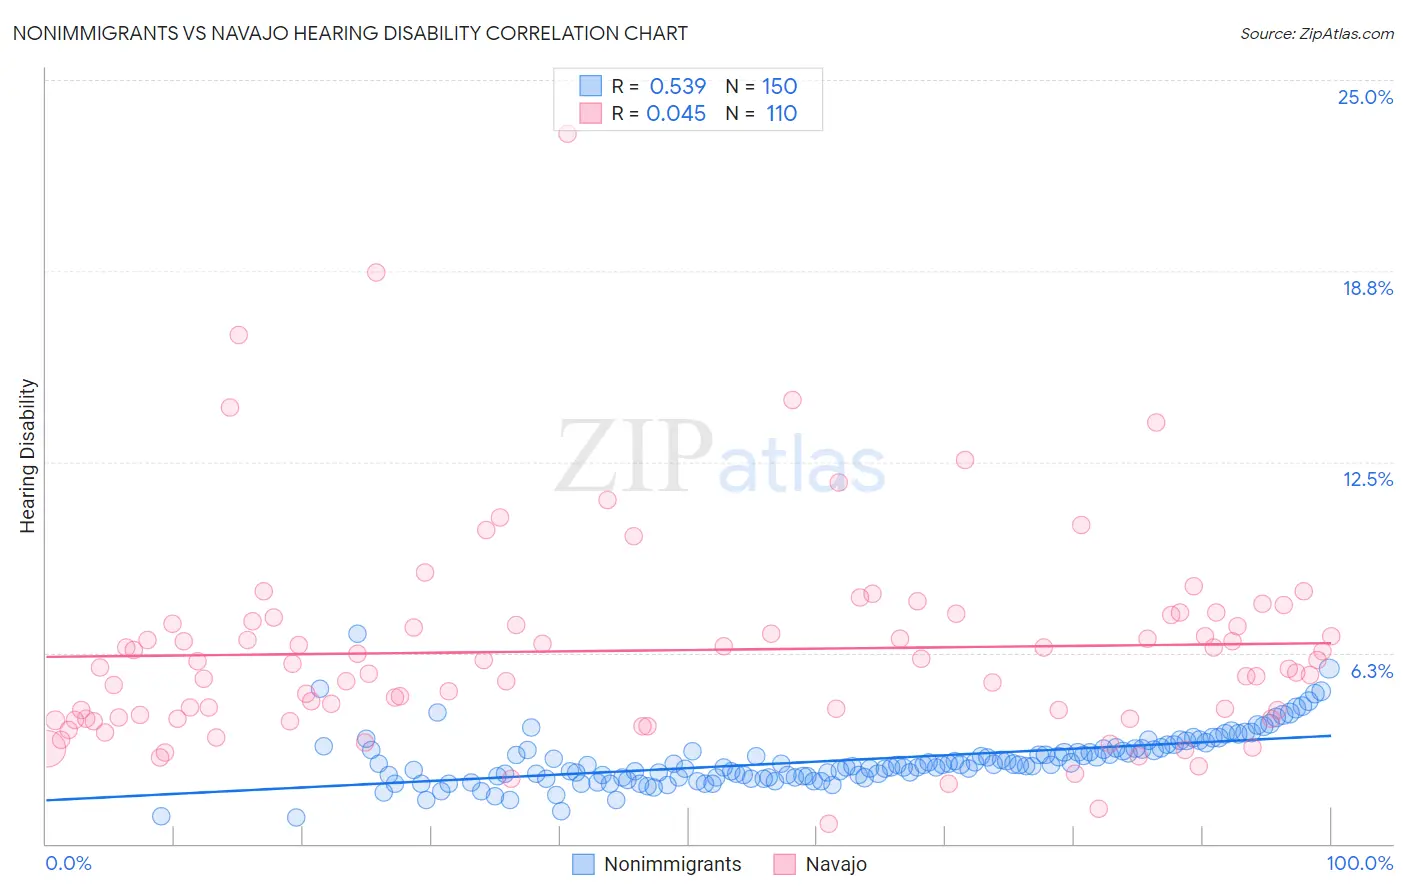
Nonimmigrants vs Navajo Hearing Disability Correlation Chart
The statistical analysis conducted on geographies consisting of 583,885,168 people shows a substantial positive correlation between the proportion of Nonimmigrants and percentage of population with hearing disability in the United States with a correlation coefficient (R) of 0.539 and weighted average of 3.6%. Similarly, the statistical analysis conducted on geographies consisting of 224,724,902 people shows no correlation between the proportion of Navajo and percentage of population with hearing disability in the United States with a correlation coefficient (R) of 0.045 and weighted average of 4.6%, a difference of 29.4%.
Hearing Disability Correlation Summary
| Measurement | Nonimmigrants | Navajo |
| Minimum | 0.87% | 0.66% |
| Maximum | 6.9% | 23.2% |
| Range | 6.0% | 22.6% |
| Mean | 2.7% | 6.3% |
| Median | 2.6% | 5.8% |
| Interquartile 25% (IQ1) | 2.2% | 4.1% |
| Interquartile 75% (IQ3) | 3.1% | 7.3% |
| Interquartile Range (IQR) | 0.92% | 3.2% |
| Standard Deviation (Sample) | 0.88% | 3.4% |
| Standard Deviation (Population) | 0.88% | 3.4% |
Similar Demographics by Hearing Disability
Demographics Similar to Nonimmigrants by Hearing Disability
In terms of hearing disability, the demographic groups most similar to Nonimmigrants are Basque (3.6%, a difference of 0.39%), Slovak (3.6%, a difference of 0.65%), Danish (3.6%, a difference of 0.70%), French American Indian (3.6%, a difference of 0.72%), and Scandinavian (3.6%, a difference of 0.78%).
| Demographics | Rating | Rank | Hearing Disability |
| Europeans | 0.1 /100 | #270 | Tragic 3.5% |
| Czechs | 0.1 /100 | #271 | Tragic 3.5% |
| Fijians | 0.0 /100 | #272 | Tragic 3.5% |
| Puerto Ricans | 0.0 /100 | #273 | Tragic 3.5% |
| Swiss | 0.0 /100 | #274 | Tragic 3.5% |
| Czechoslovakians | 0.0 /100 | #275 | Tragic 3.6% |
| Danes | 0.0 /100 | #276 | Tragic 3.6% |
| Immigrants | Nonimmigrants | 0.0 /100 | #277 | Tragic 3.6% |
| Basques | 0.0 /100 | #278 | Tragic 3.6% |
| Slovaks | 0.0 /100 | #279 | Tragic 3.6% |
| French American Indians | 0.0 /100 | #280 | Tragic 3.6% |
| Scandinavians | 0.0 /100 | #281 | Tragic 3.6% |
| Swedes | 0.0 /100 | #282 | Tragic 3.6% |
| Blackfeet | 0.0 /100 | #283 | Tragic 3.6% |
| Immigrants | Micronesia | 0.0 /100 | #284 | Tragic 3.6% |
Demographics Similar to Navajo by Hearing Disability
In terms of hearing disability, the demographic groups most similar to Navajo are Pueblo (4.6%, a difference of 0.33%), Tsimshian (4.7%, a difference of 1.5%), Inupiat (4.7%, a difference of 1.8%), Choctaw (4.5%, a difference of 1.8%), and Alaska Native (4.5%, a difference of 3.3%).
| Demographics | Rating | Rank | Hearing Disability |
| Dutch West Indians | 0.0 /100 | #333 | Tragic 4.3% |
| Aleuts | 0.0 /100 | #334 | Tragic 4.3% |
| Kiowa | 0.0 /100 | #335 | Tragic 4.3% |
| Creek | 0.0 /100 | #336 | Tragic 4.4% |
| Chickasaw | 0.0 /100 | #337 | Tragic 4.5% |
| Alaska Natives | 0.0 /100 | #338 | Tragic 4.5% |
| Choctaw | 0.0 /100 | #339 | Tragic 4.5% |
| Pueblo | 0.0 /100 | #340 | Tragic 4.6% |
| Navajo | 0.0 /100 | #341 | Tragic 4.6% |
| Tsimshian | 0.0 /100 | #342 | Tragic 4.7% |
| Inupiat | 0.0 /100 | #343 | Tragic 4.7% |
| Tlingit-Haida | 0.0 /100 | #344 | Tragic 4.8% |
| Alaskan Athabascans | 0.0 /100 | #345 | Tragic 5.3% |
| Colville | 0.0 /100 | #346 | Tragic 5.3% |
| Yup'ik | 0.0 /100 | #347 | Tragic 5.8% |