Nonimmigrants vs Navajo Unemployment Among Women with Children Under 6 years
COMPARE
Nonimmigrants
Navajo
Unemployment Among Women with Children Under 6 years
Unemployment Among Women with Children Under 6 years Comparison
Nonimmigrants
Navajo
8.8%
UNEMPLOYMENT AMONG WOMEN WITH CHILDREN UNDER 6 YEARS
0.0/ 100
METRIC RATING
294th/ 347
METRIC RANK
13.5%
UNEMPLOYMENT AMONG WOMEN WITH CHILDREN UNDER 6 YEARS
0.0/ 100
METRIC RATING
339th/ 347
METRIC RANK
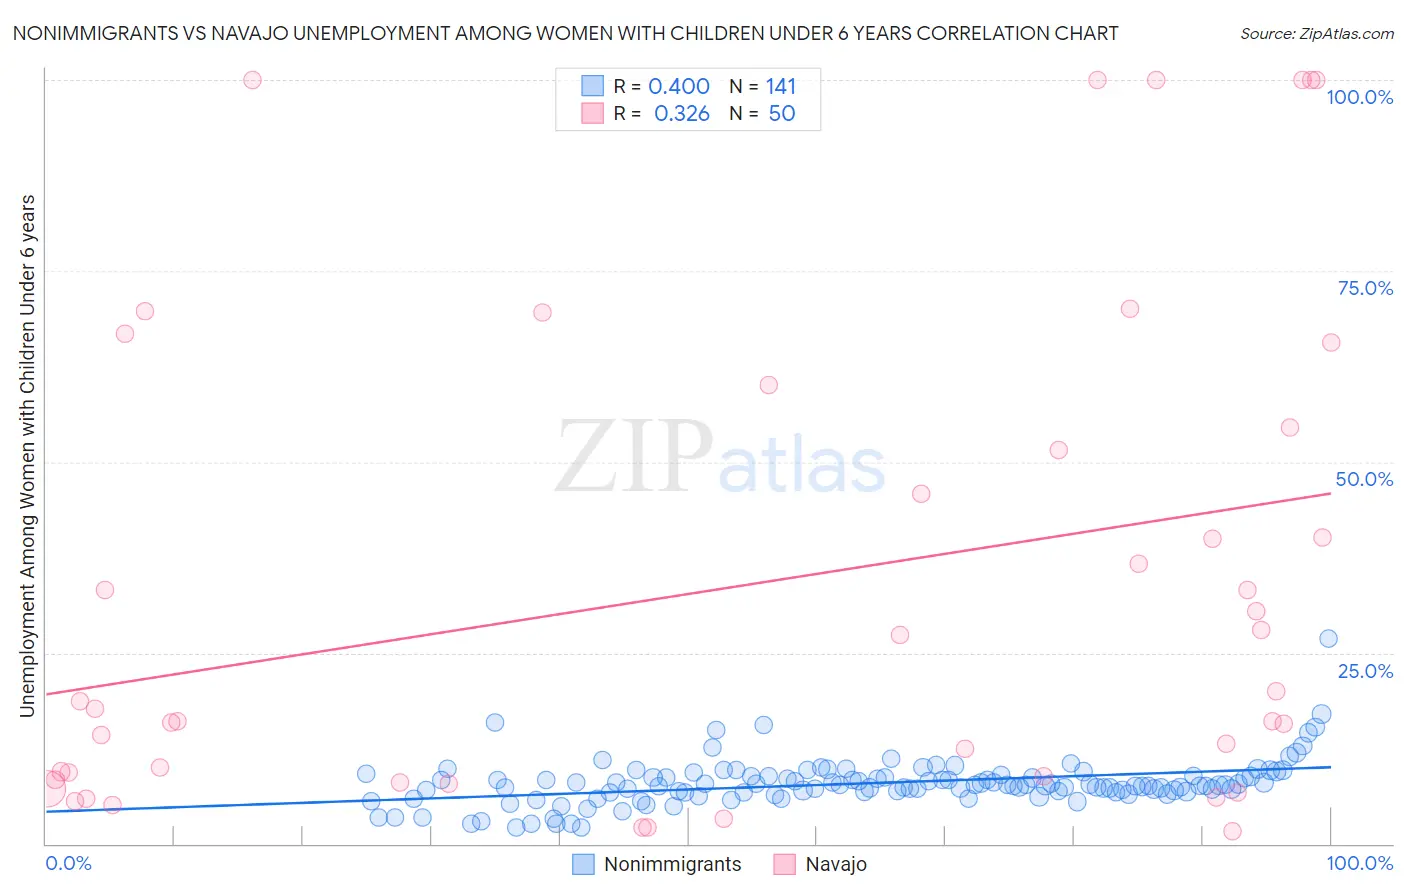
Nonimmigrants vs Navajo Unemployment Among Women with Children Under 6 years Correlation Chart
The statistical analysis conducted on geographies consisting of 381,284,375 people shows a mild positive correlation between the proportion of Nonimmigrants and unemployment rate among women with children under the age of 6 in the United States with a correlation coefficient (R) of 0.400 and weighted average of 8.8%. Similarly, the statistical analysis conducted on geographies consisting of 189,295,070 people shows a mild positive correlation between the proportion of Navajo and unemployment rate among women with children under the age of 6 in the United States with a correlation coefficient (R) of 0.326 and weighted average of 13.5%, a difference of 52.4%.
Unemployment Among Women with Children Under 6 years Correlation Summary
| Measurement | Nonimmigrants | Navajo |
| Minimum | 2.1% | 1.7% |
| Maximum | 26.9% | 100.0% |
| Range | 24.8% | 98.3% |
| Mean | 8.0% | 33.8% |
| Median | 7.7% | 18.1% |
| Interquartile 25% (IQ1) | 6.8% | 8.4% |
| Interquartile 75% (IQ3) | 8.8% | 54.5% |
| Interquartile Range (IQR) | 2.1% | 46.1% |
| Standard Deviation (Sample) | 3.0% | 32.0% |
| Standard Deviation (Population) | 3.0% | 31.7% |
Similar Demographics by Unemployment Among Women with Children Under 6 years
Demographics Similar to Nonimmigrants by Unemployment Among Women with Children Under 6 years
In terms of unemployment among women with children under 6 years, the demographic groups most similar to Nonimmigrants are Immigrants from Central America (8.9%, a difference of 0.050%), Immigrants from Dominican Republic (8.9%, a difference of 0.18%), Immigrants from Bangladesh (8.8%, a difference of 0.19%), Mexican (8.9%, a difference of 0.27%), and Cheyenne (8.8%, a difference of 0.42%).
| Demographics | Rating | Rank | Unemployment Among Women with Children Under 6 years |
| Menominee | 0.0 /100 | #287 | Tragic 8.7% |
| Bahamians | 0.0 /100 | #288 | Tragic 8.7% |
| Iroquois | 0.0 /100 | #289 | Tragic 8.7% |
| Vietnamese | 0.0 /100 | #290 | Tragic 8.8% |
| Jamaicans | 0.0 /100 | #291 | Tragic 8.8% |
| Cheyenne | 0.0 /100 | #292 | Tragic 8.8% |
| Immigrants | Bangladesh | 0.0 /100 | #293 | Tragic 8.8% |
| Immigrants | Nonimmigrants | 0.0 /100 | #294 | Tragic 8.8% |
| Immigrants | Central America | 0.0 /100 | #295 | Tragic 8.9% |
| Immigrants | Dominican Republic | 0.0 /100 | #296 | Tragic 8.9% |
| Mexicans | 0.0 /100 | #297 | Tragic 8.9% |
| Tlingit-Haida | 0.0 /100 | #298 | Tragic 8.9% |
| Immigrants | Jamaica | 0.0 /100 | #299 | Tragic 8.9% |
| Creek | 0.0 /100 | #300 | Tragic 8.9% |
| Chickasaw | 0.0 /100 | #301 | Tragic 9.0% |
Demographics Similar to Navajo by Unemployment Among Women with Children Under 6 years
In terms of unemployment among women with children under 6 years, the demographic groups most similar to Navajo are Immigrants from Yemen (13.5%, a difference of 0.0%), Pima (13.4%, a difference of 0.40%), Chippewa (13.3%, a difference of 1.2%), Lumbee (13.8%, a difference of 2.2%), and Shoshone (13.2%, a difference of 2.3%).
| Demographics | Rating | Rank | Unemployment Among Women with Children Under 6 years |
| Sioux | 0.0 /100 | #332 | Tragic 11.5% |
| Natives/Alaskans | 0.0 /100 | #333 | Tragic 11.5% |
| Apache | 0.0 /100 | #334 | Tragic 12.3% |
| Puerto Ricans | 0.0 /100 | #335 | Tragic 12.5% |
| Shoshone | 0.0 /100 | #336 | Tragic 13.2% |
| Chippewa | 0.0 /100 | #337 | Tragic 13.3% |
| Pima | 0.0 /100 | #338 | Tragic 13.4% |
| Navajo | 0.0 /100 | #339 | Tragic 13.5% |
| Immigrants | Yemen | 0.0 /100 | #340 | Tragic 13.5% |
| Lumbee | 0.0 /100 | #341 | Tragic 13.8% |
| Yuman | 0.0 /100 | #342 | Tragic 14.6% |
| Crow | 0.0 /100 | #343 | Tragic 14.6% |
| Hopi | 0.0 /100 | #344 | Tragic 16.8% |
| Inupiat | 0.0 /100 | #345 | Tragic 17.7% |
| Arapaho | 0.0 /100 | #346 | Tragic 19.0% |