Nigerian vs Soviet Union 4th Grade
COMPARE
Nigerian
Soviet Union
4th Grade
4th Grade Comparison
Nigerians
Soviet Union
97.1%
4TH GRADE
1.8/ 100
METRIC RATING
239th/ 347
METRIC RANK
97.6%
4TH GRADE
77.8/ 100
METRIC RATING
149th/ 347
METRIC RANK
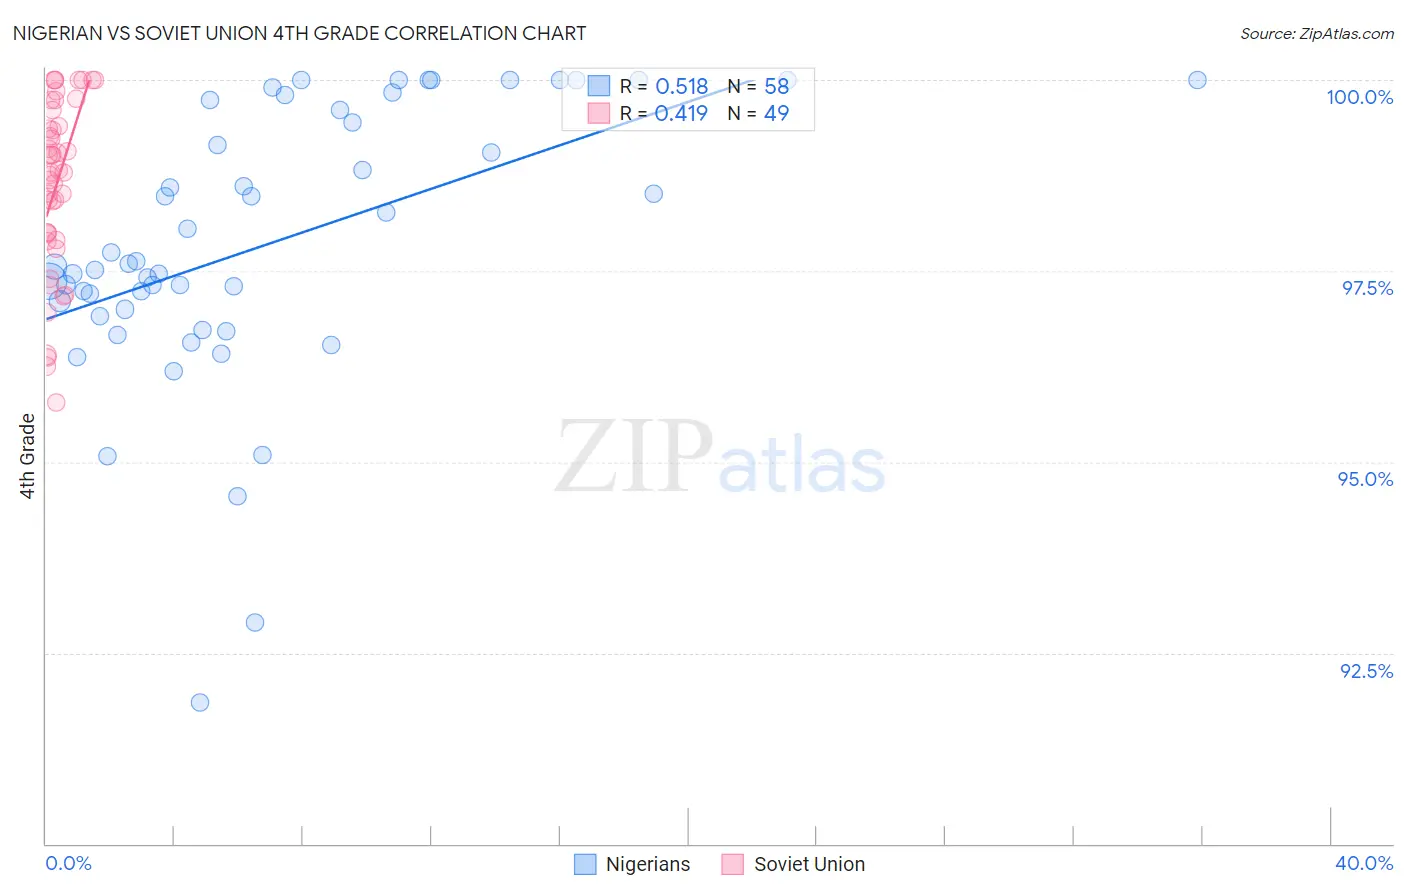
Nigerian vs Soviet Union 4th Grade Correlation Chart
The statistical analysis conducted on geographies consisting of 332,724,627 people shows a substantial positive correlation between the proportion of Nigerians and percentage of population with at least 4th grade education in the United States with a correlation coefficient (R) of 0.518 and weighted average of 97.1%. Similarly, the statistical analysis conducted on geographies consisting of 43,454,395 people shows a moderate positive correlation between the proportion of Soviet Union and percentage of population with at least 4th grade education in the United States with a correlation coefficient (R) of 0.419 and weighted average of 97.6%, a difference of 0.50%.
4th Grade Correlation Summary
| Measurement | Nigerian | Soviet Union |
| Minimum | 91.9% | 95.8% |
| Maximum | 100.0% | 100.0% |
| Range | 8.1% | 4.2% |
| Mean | 97.9% | 98.6% |
| Median | 97.6% | 98.8% |
| Interquartile 25% (IQ1) | 97.0% | 97.9% |
| Interquartile 75% (IQ3) | 99.6% | 99.5% |
| Interquartile Range (IQR) | 2.6% | 1.6% |
| Standard Deviation (Sample) | 1.8% | 1.1% |
| Standard Deviation (Population) | 1.8% | 1.1% |
Similar Demographics by 4th Grade
Demographics Similar to Nigerians by 4th Grade
In terms of 4th grade, the demographic groups most similar to Nigerians are Immigrants from Costa Rica (97.2%, a difference of 0.010%), Indian (Asian) (97.2%, a difference of 0.010%), Colombian (97.1%, a difference of 0.010%), Immigrants from Indonesia (97.1%, a difference of 0.010%), and Asian (97.1%, a difference of 0.020%).
| Demographics | Rating | Rank | 4th Grade |
| Immigrants | Western Asia | 3.4 /100 | #232 | Tragic 97.2% |
| Senegalese | 3.1 /100 | #233 | Tragic 97.2% |
| Assyrians/Chaldeans/Syriacs | 3.0 /100 | #234 | Tragic 97.2% |
| Yuman | 2.9 /100 | #235 | Tragic 97.2% |
| Immigrants | Eastern Asia | 2.7 /100 | #236 | Tragic 97.2% |
| Immigrants | Costa Rica | 2.0 /100 | #237 | Tragic 97.2% |
| Indians (Asian) | 1.9 /100 | #238 | Tragic 97.2% |
| Nigerians | 1.8 /100 | #239 | Tragic 97.1% |
| Colombians | 1.6 /100 | #240 | Tragic 97.1% |
| Immigrants | Indonesia | 1.5 /100 | #241 | Tragic 97.1% |
| Asians | 1.4 /100 | #242 | Tragic 97.1% |
| U.S. Virgin Islanders | 1.4 /100 | #243 | Tragic 97.1% |
| Koreans | 1.3 /100 | #244 | Tragic 97.1% |
| Immigrants | Eastern Africa | 1.2 /100 | #245 | Tragic 97.1% |
| Immigrants | Uruguay | 1.2 /100 | #246 | Tragic 97.1% |
Demographics Similar to Soviet Union by 4th Grade
In terms of 4th grade, the demographic groups most similar to Soviet Union are Immigrants from Israel (97.6%, a difference of 0.0%), Alsatian (97.6%, a difference of 0.0%), Immigrants from South Central Asia (97.6%, a difference of 0.010%), Jordanian (97.7%, a difference of 0.020%), and Ute (97.7%, a difference of 0.020%).
| Demographics | Rating | Rank | 4th Grade |
| Immigrants | North Macedonia | 83.3 /100 | #142 | Excellent 97.7% |
| Burmese | 82.8 /100 | #143 | Excellent 97.7% |
| Spaniards | 82.7 /100 | #144 | Excellent 97.7% |
| Immigrants | Moldova | 82.4 /100 | #145 | Excellent 97.7% |
| Jordanians | 81.3 /100 | #146 | Excellent 97.7% |
| Ute | 80.6 /100 | #147 | Excellent 97.7% |
| Hopi | 80.6 /100 | #148 | Excellent 97.7% |
| Soviet Union | 77.8 /100 | #149 | Good 97.6% |
| Immigrants | Israel | 77.7 /100 | #150 | Good 97.6% |
| Alsatians | 77.2 /100 | #151 | Good 97.6% |
| Immigrants | South Central Asia | 76.2 /100 | #152 | Good 97.6% |
| Immigrants | Eastern Europe | 71.3 /100 | #153 | Good 97.6% |
| Immigrants | Russia | 67.0 /100 | #154 | Good 97.6% |
| Albanians | 67.0 /100 | #155 | Good 97.6% |
| Immigrants | Jordan | 66.9 /100 | #156 | Good 97.6% |