Nigerian vs Immigrants from Haiti Single Male Poverty
COMPARE
Nigerian
Immigrants from Haiti
Single Male Poverty
Single Male Poverty Comparison
Nigerians
Immigrants from Haiti
12.9%
SINGLE MALE POVERTY
31.9/ 100
METRIC RATING
186th/ 347
METRIC RANK
13.1%
SINGLE MALE POVERTY
16.8/ 100
METRIC RATING
210th/ 347
METRIC RANK
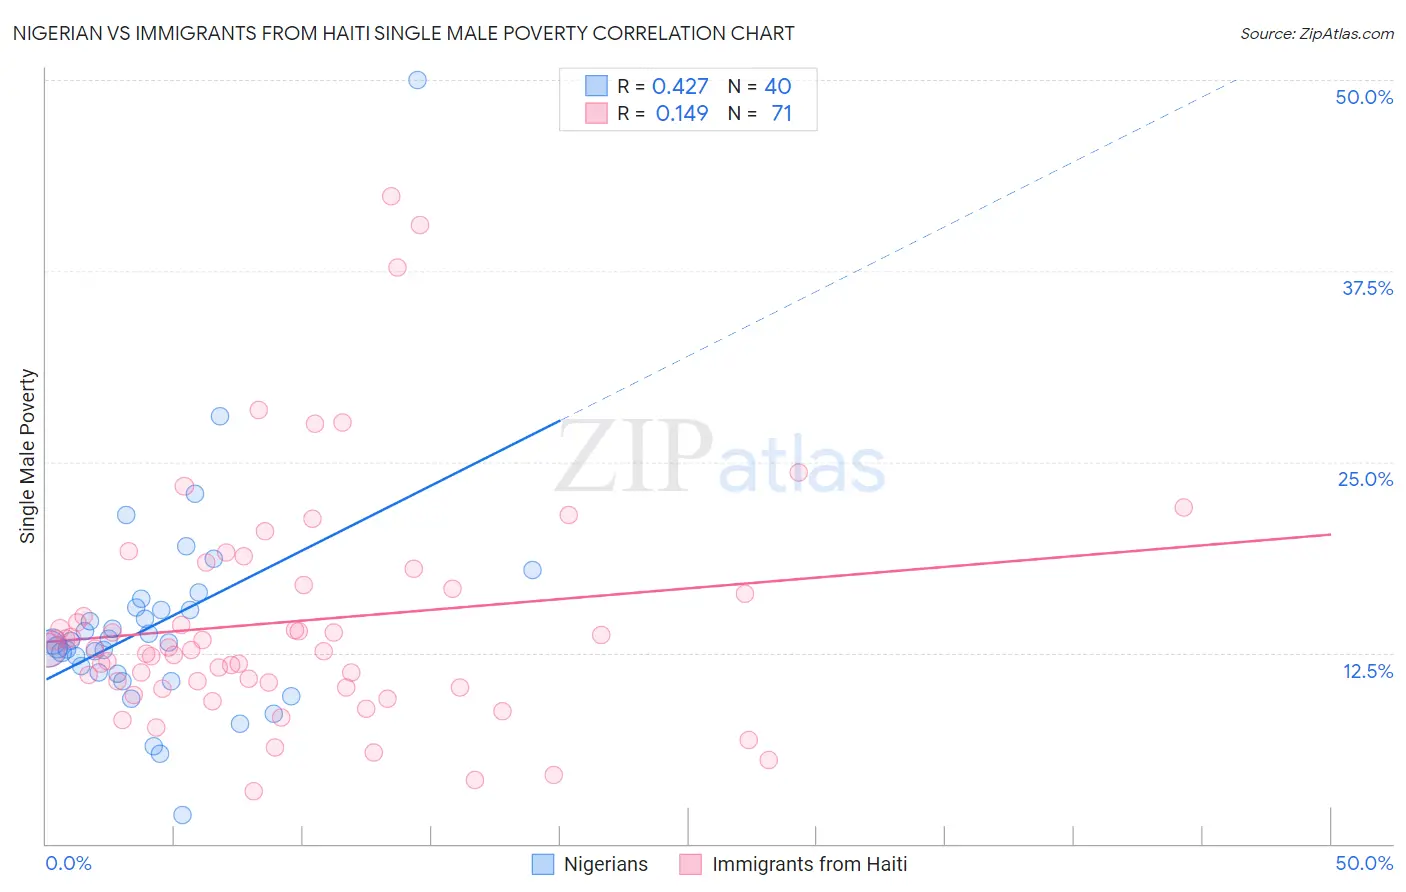
Nigerian vs Immigrants from Haiti Single Male Poverty Correlation Chart
The statistical analysis conducted on geographies consisting of 304,027,429 people shows a moderate positive correlation between the proportion of Nigerians and poverty level among single males in the United States with a correlation coefficient (R) of 0.427 and weighted average of 12.9%. Similarly, the statistical analysis conducted on geographies consisting of 207,631,435 people shows a poor positive correlation between the proportion of Immigrants from Haiti and poverty level among single males in the United States with a correlation coefficient (R) of 0.149 and weighted average of 13.1%, a difference of 1.1%.
Single Male Poverty Correlation Summary
| Measurement | Nigerian | Immigrants from Haiti |
| Minimum | 1.9% | 3.4% |
| Maximum | 50.0% | 42.4% |
| Range | 48.1% | 39.0% |
| Mean | 14.4% | 14.6% |
| Median | 13.2% | 12.7% |
| Interquartile 25% (IQ1) | 11.2% | 10.2% |
| Interquartile 75% (IQ3) | 15.4% | 17.0% |
| Interquartile Range (IQR) | 4.2% | 6.8% |
| Standard Deviation (Sample) | 7.4% | 7.7% |
| Standard Deviation (Population) | 7.3% | 7.6% |
Similar Demographics by Single Male Poverty
Demographics Similar to Nigerians by Single Male Poverty
In terms of single male poverty, the demographic groups most similar to Nigerians are Norwegian (12.9%, a difference of 0.0%), Immigrants from Kuwait (12.9%, a difference of 0.0%), Immigrants from Trinidad and Tobago (12.9%, a difference of 0.030%), Macedonian (12.9%, a difference of 0.030%), and Immigrants from West Indies (12.9%, a difference of 0.060%).
| Demographics | Rating | Rank | Single Male Poverty |
| Israelis | 41.0 /100 | #179 | Average 12.9% |
| Immigrants | North America | 37.7 /100 | #180 | Fair 12.9% |
| Panamanians | 37.6 /100 | #181 | Fair 12.9% |
| Moroccans | 36.8 /100 | #182 | Fair 12.9% |
| Immigrants | West Indies | 33.0 /100 | #183 | Fair 12.9% |
| Immigrants | Trinidad and Tobago | 32.5 /100 | #184 | Fair 12.9% |
| Norwegians | 32.0 /100 | #185 | Fair 12.9% |
| Nigerians | 31.9 /100 | #186 | Fair 12.9% |
| Immigrants | Kuwait | 31.9 /100 | #187 | Fair 12.9% |
| Macedonians | 31.5 /100 | #188 | Fair 12.9% |
| Portuguese | 30.2 /100 | #189 | Fair 12.9% |
| Arabs | 27.0 /100 | #190 | Fair 13.0% |
| Immigrants | Thailand | 26.6 /100 | #191 | Fair 13.0% |
| Immigrants | Jamaica | 26.5 /100 | #192 | Fair 13.0% |
| Immigrants | South Africa | 26.1 /100 | #193 | Fair 13.0% |
Demographics Similar to Immigrants from Haiti by Single Male Poverty
In terms of single male poverty, the demographic groups most similar to Immigrants from Haiti are Swedish (13.1%, a difference of 0.010%), Senegalese (13.1%, a difference of 0.040%), Mexican American Indian (13.1%, a difference of 0.060%), Immigrants from Western Africa (13.1%, a difference of 0.070%), and Sudanese (13.1%, a difference of 0.080%).
| Demographics | Rating | Rank | Single Male Poverty |
| Immigrants | Bangladesh | 20.4 /100 | #203 | Fair 13.0% |
| Estonians | 20.3 /100 | #204 | Fair 13.0% |
| Poles | 19.3 /100 | #205 | Poor 13.0% |
| Northern Europeans | 18.9 /100 | #206 | Poor 13.0% |
| Sudanese | 17.7 /100 | #207 | Poor 13.1% |
| Immigrants | Western Africa | 17.6 /100 | #208 | Poor 13.1% |
| Mexican American Indians | 17.5 /100 | #209 | Poor 13.1% |
| Immigrants | Haiti | 16.8 /100 | #210 | Poor 13.1% |
| Swedes | 16.8 /100 | #211 | Poor 13.1% |
| Senegalese | 16.4 /100 | #212 | Poor 13.1% |
| Italians | 15.9 /100 | #213 | Poor 13.1% |
| Zimbabweans | 14.9 /100 | #214 | Poor 13.1% |
| Japanese | 14.8 /100 | #215 | Poor 13.1% |
| Austrians | 13.9 /100 | #216 | Poor 13.1% |
| Bermudans | 13.0 /100 | #217 | Poor 13.1% |