Nicaraguan vs Mexican American Indian Family Poverty
COMPARE
Nicaraguan
Mexican American Indian
Family Poverty
Family Poverty Comparison
Nicaraguans
Mexican American Indians
10.6%
FAMILY POVERTY
0.4/ 100
METRIC RATING
248th/ 347
METRIC RANK
10.9%
FAMILY POVERTY
0.2/ 100
METRIC RATING
259th/ 347
METRIC RANK
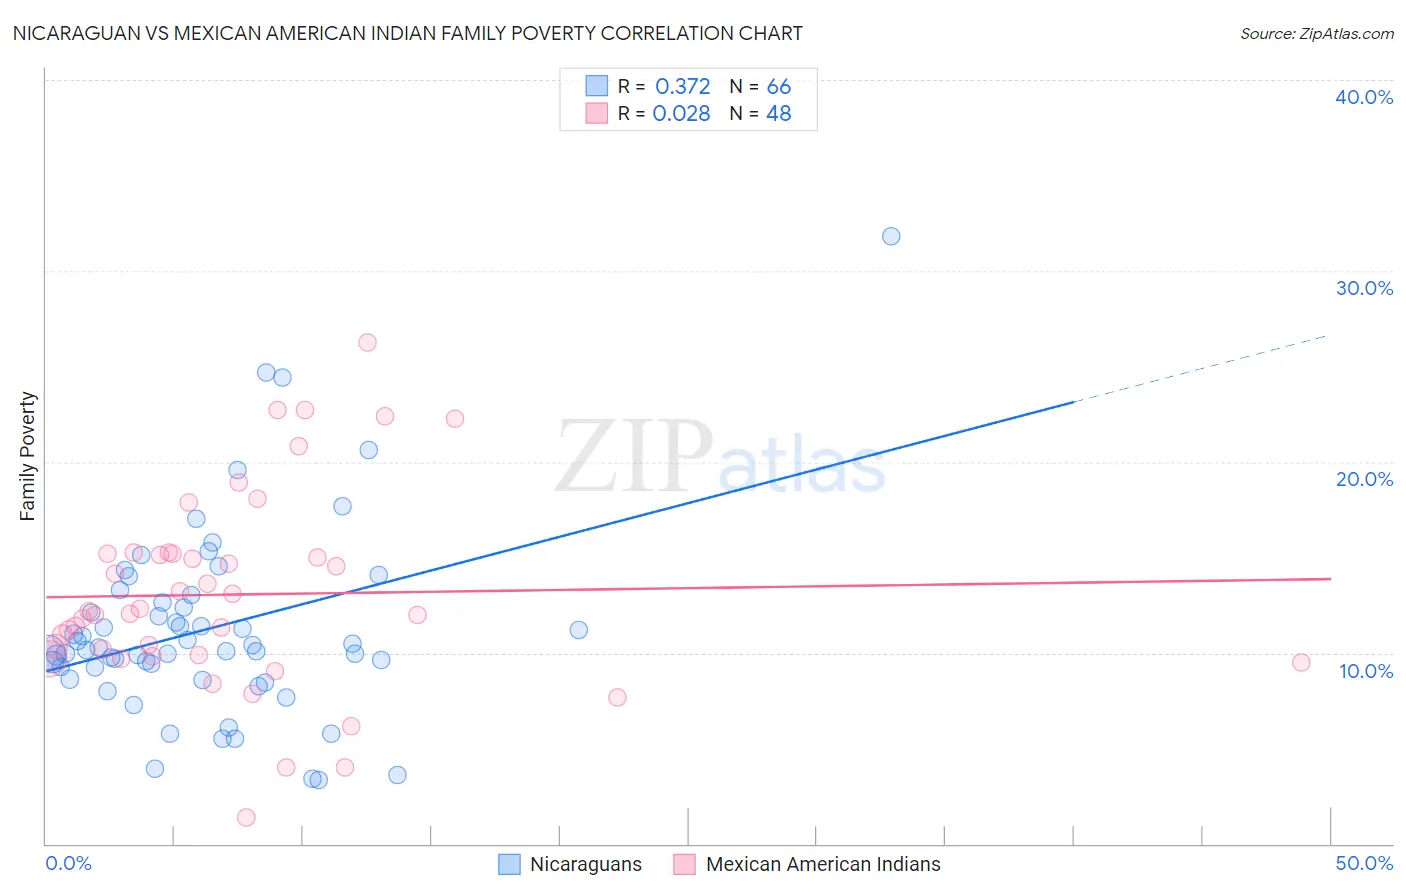
Nicaraguan vs Mexican American Indian Family Poverty Correlation Chart
The statistical analysis conducted on geographies consisting of 285,444,498 people shows a mild positive correlation between the proportion of Nicaraguans and poverty level among families in the United States with a correlation coefficient (R) of 0.372 and weighted average of 10.6%. Similarly, the statistical analysis conducted on geographies consisting of 317,307,658 people shows no correlation between the proportion of Mexican American Indians and poverty level among families in the United States with a correlation coefficient (R) of 0.028 and weighted average of 10.9%, a difference of 2.1%.
Family Poverty Correlation Summary
| Measurement | Nicaraguan | Mexican American Indian |
| Minimum | 3.3% | 1.4% |
| Maximum | 31.8% | 26.3% |
| Range | 28.5% | 24.9% |
| Mean | 11.2% | 13.1% |
| Median | 10.2% | 12.1% |
| Interquartile 25% (IQ1) | 9.2% | 9.9% |
| Interquartile 75% (IQ3) | 12.6% | 15.2% |
| Interquartile Range (IQR) | 3.4% | 5.3% |
| Standard Deviation (Sample) | 5.0% | 5.2% |
| Standard Deviation (Population) | 4.9% | 5.1% |
Demographics Similar to Nicaraguans and Mexican American Indians by Family Poverty
In terms of family poverty, the demographic groups most similar to Nicaraguans are Cuban (10.6%, a difference of 0.050%), Liberian (10.6%, a difference of 0.20%), Cherokee (10.6%, a difference of 0.29%), Salvadoran (10.7%, a difference of 0.57%), and Iroquois (10.7%, a difference of 0.86%). Similarly, the demographic groups most similar to Mexican American Indians are Subsaharan African (10.9%, a difference of 0.040%), Immigrants from Ghana (10.8%, a difference of 0.070%), Chickasaw (10.8%, a difference of 0.11%), Bangladeshi (10.9%, a difference of 0.35%), and Immigrants from Liberia (10.8%, a difference of 0.38%).
| Demographics | Rating | Rank | Family Poverty |
| Nepalese | 0.8 /100 | #243 | Tragic 10.4% |
| Cree | 0.7 /100 | #244 | Tragic 10.5% |
| Immigrants | Burma/Myanmar | 0.6 /100 | #245 | Tragic 10.5% |
| Cherokee | 0.5 /100 | #246 | Tragic 10.6% |
| Liberians | 0.4 /100 | #247 | Tragic 10.6% |
| Nicaraguans | 0.4 /100 | #248 | Tragic 10.6% |
| Cubans | 0.4 /100 | #249 | Tragic 10.6% |
| Salvadorans | 0.3 /100 | #250 | Tragic 10.7% |
| Iroquois | 0.3 /100 | #251 | Tragic 10.7% |
| Immigrants | Zaire | 0.3 /100 | #252 | Tragic 10.7% |
| Immigrants | Western Africa | 0.3 /100 | #253 | Tragic 10.7% |
| Ecuadorians | 0.2 /100 | #254 | Tragic 10.8% |
| Immigrants | Liberia | 0.2 /100 | #255 | Tragic 10.8% |
| Chickasaw | 0.2 /100 | #256 | Tragic 10.8% |
| Immigrants | Ghana | 0.2 /100 | #257 | Tragic 10.8% |
| Sub-Saharan Africans | 0.2 /100 | #258 | Tragic 10.9% |
| Mexican American Indians | 0.2 /100 | #259 | Tragic 10.9% |
| Bangladeshis | 0.2 /100 | #260 | Tragic 10.9% |
| Shoshone | 0.2 /100 | #261 | Tragic 10.9% |
| Spanish American Indians | 0.2 /100 | #262 | Tragic 10.9% |
| Cape Verdeans | 0.1 /100 | #263 | Tragic 10.9% |