Nicaraguan vs Portuguese Family Poverty
COMPARE
Nicaraguan
Portuguese
Family Poverty
Family Poverty Comparison
Nicaraguans
Portuguese
10.6%
FAMILY POVERTY
0.4/ 100
METRIC RATING
248th/ 347
METRIC RANK
8.4%
FAMILY POVERTY
89.2/ 100
METRIC RATING
129th/ 347
METRIC RANK
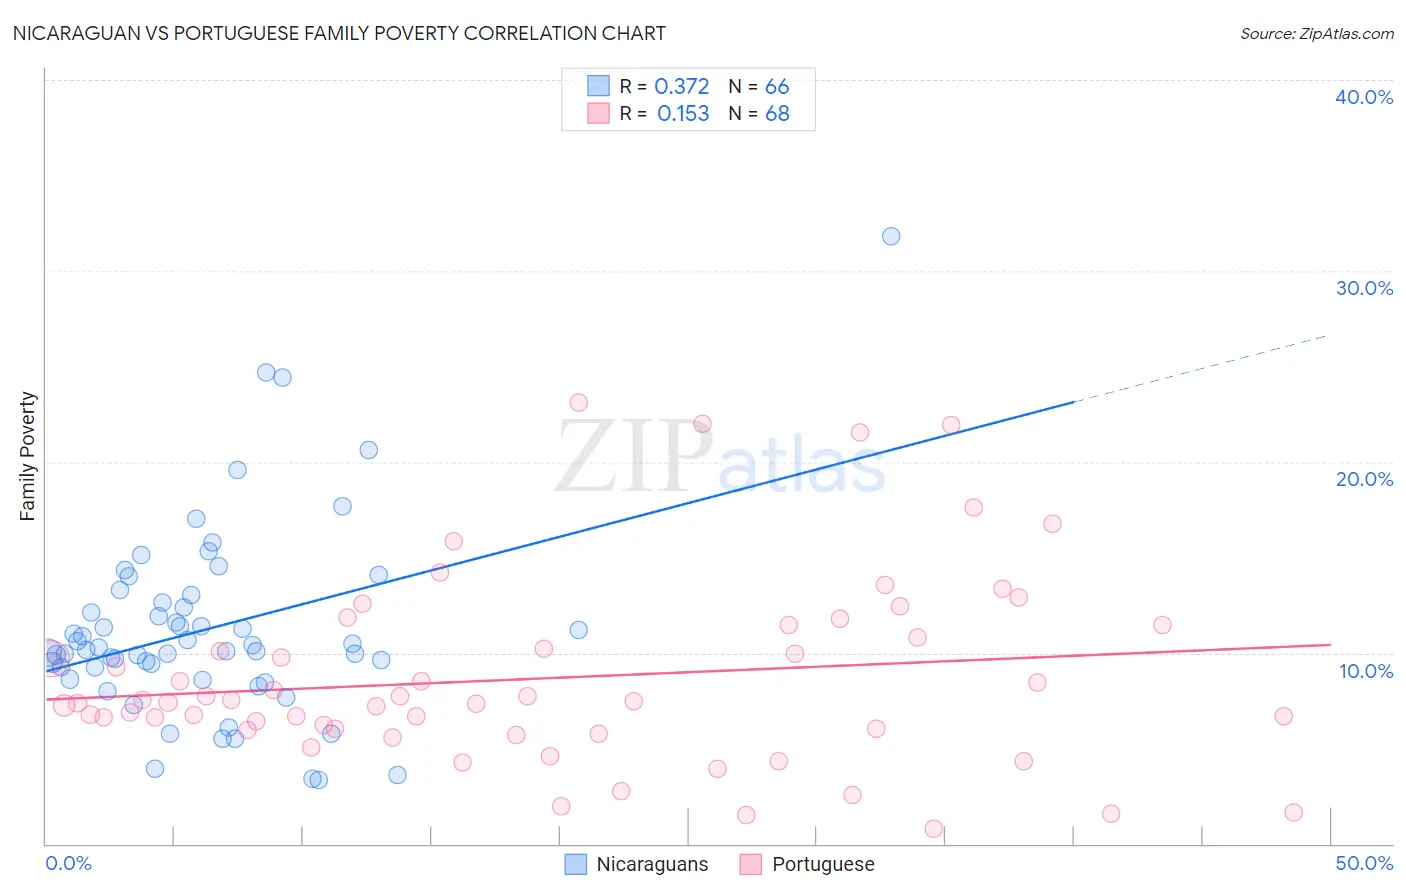
Nicaraguan vs Portuguese Family Poverty Correlation Chart
The statistical analysis conducted on geographies consisting of 285,444,498 people shows a mild positive correlation between the proportion of Nicaraguans and poverty level among families in the United States with a correlation coefficient (R) of 0.372 and weighted average of 10.6%. Similarly, the statistical analysis conducted on geographies consisting of 448,364,700 people shows a poor positive correlation between the proportion of Portuguese and poverty level among families in the United States with a correlation coefficient (R) of 0.153 and weighted average of 8.4%, a difference of 26.8%.
Family Poverty Correlation Summary
| Measurement | Nicaraguan | Portuguese |
| Minimum | 3.3% | 0.81% |
| Maximum | 31.8% | 23.1% |
| Range | 28.5% | 22.3% |
| Mean | 11.2% | 8.7% |
| Median | 10.2% | 7.5% |
| Interquartile 25% (IQ1) | 9.2% | 6.0% |
| Interquartile 75% (IQ3) | 12.6% | 11.1% |
| Interquartile Range (IQR) | 3.4% | 5.1% |
| Standard Deviation (Sample) | 5.0% | 5.0% |
| Standard Deviation (Population) | 4.9% | 4.9% |
Similar Demographics by Family Poverty
Demographics Similar to Nicaraguans by Family Poverty
In terms of family poverty, the demographic groups most similar to Nicaraguans are Cuban (10.6%, a difference of 0.050%), Liberian (10.6%, a difference of 0.20%), Cherokee (10.6%, a difference of 0.29%), Salvadoran (10.7%, a difference of 0.57%), and Iroquois (10.7%, a difference of 0.86%).
| Demographics | Rating | Rank | Family Poverty |
| Ghanaians | 1.3 /100 | #241 | Tragic 10.3% |
| Alaska Natives | 1.0 /100 | #242 | Tragic 10.4% |
| Nepalese | 0.8 /100 | #243 | Tragic 10.4% |
| Cree | 0.7 /100 | #244 | Tragic 10.5% |
| Immigrants | Burma/Myanmar | 0.6 /100 | #245 | Tragic 10.5% |
| Cherokee | 0.5 /100 | #246 | Tragic 10.6% |
| Liberians | 0.4 /100 | #247 | Tragic 10.6% |
| Nicaraguans | 0.4 /100 | #248 | Tragic 10.6% |
| Cubans | 0.4 /100 | #249 | Tragic 10.6% |
| Salvadorans | 0.3 /100 | #250 | Tragic 10.7% |
| Iroquois | 0.3 /100 | #251 | Tragic 10.7% |
| Immigrants | Zaire | 0.3 /100 | #252 | Tragic 10.7% |
| Immigrants | Western Africa | 0.3 /100 | #253 | Tragic 10.7% |
| Ecuadorians | 0.2 /100 | #254 | Tragic 10.8% |
| Immigrants | Liberia | 0.2 /100 | #255 | Tragic 10.8% |
Demographics Similar to Portuguese by Family Poverty
In terms of family poverty, the demographic groups most similar to Portuguese are Argentinean (8.4%, a difference of 0.15%), Immigrants from Bosnia and Herzegovina (8.4%, a difference of 0.18%), Puget Sound Salish (8.4%, a difference of 0.19%), Immigrants from Hungary (8.4%, a difference of 0.30%), and Immigrants from Argentina (8.4%, a difference of 0.34%).
| Demographics | Rating | Rank | Family Poverty |
| Paraguayans | 91.2 /100 | #122 | Exceptional 8.3% |
| Palestinians | 91.1 /100 | #123 | Exceptional 8.3% |
| Soviet Union | 90.8 /100 | #124 | Exceptional 8.3% |
| Pakistanis | 90.8 /100 | #125 | Exceptional 8.3% |
| Icelanders | 90.3 /100 | #126 | Exceptional 8.3% |
| Immigrants | Hungary | 89.9 /100 | #127 | Excellent 8.4% |
| Argentineans | 89.6 /100 | #128 | Excellent 8.4% |
| Portuguese | 89.2 /100 | #129 | Excellent 8.4% |
| Immigrants | Bosnia and Herzegovina | 88.6 /100 | #130 | Excellent 8.4% |
| Puget Sound Salish | 88.6 /100 | #131 | Excellent 8.4% |
| Immigrants | Argentina | 88.2 /100 | #132 | Excellent 8.4% |
| Sri Lankans | 86.6 /100 | #133 | Excellent 8.5% |
| Chileans | 86.6 /100 | #134 | Excellent 8.5% |
| Immigrants | Malaysia | 86.5 /100 | #135 | Excellent 8.5% |
| Immigrants | Brazil | 86.3 /100 | #136 | Excellent 8.5% |