Nepalese vs Trinidadian and Tobagonian Female Poverty Among 18-24 Year Olds
COMPARE
Nepalese
Trinidadian and Tobagonian
Female Poverty Among 18-24 Year Olds
Female Poverty Among 18-24 Year Olds Comparison
Nepalese
Trinidadians and Tobagonians
20.2%
FEMALE POVERTY AMONG 18-24 YEAR OLDS
39.7/ 100
METRIC RATING
185th/ 347
METRIC RANK
19.8%
FEMALE POVERTY AMONG 18-24 YEAR OLDS
74.4/ 100
METRIC RATING
159th/ 347
METRIC RANK
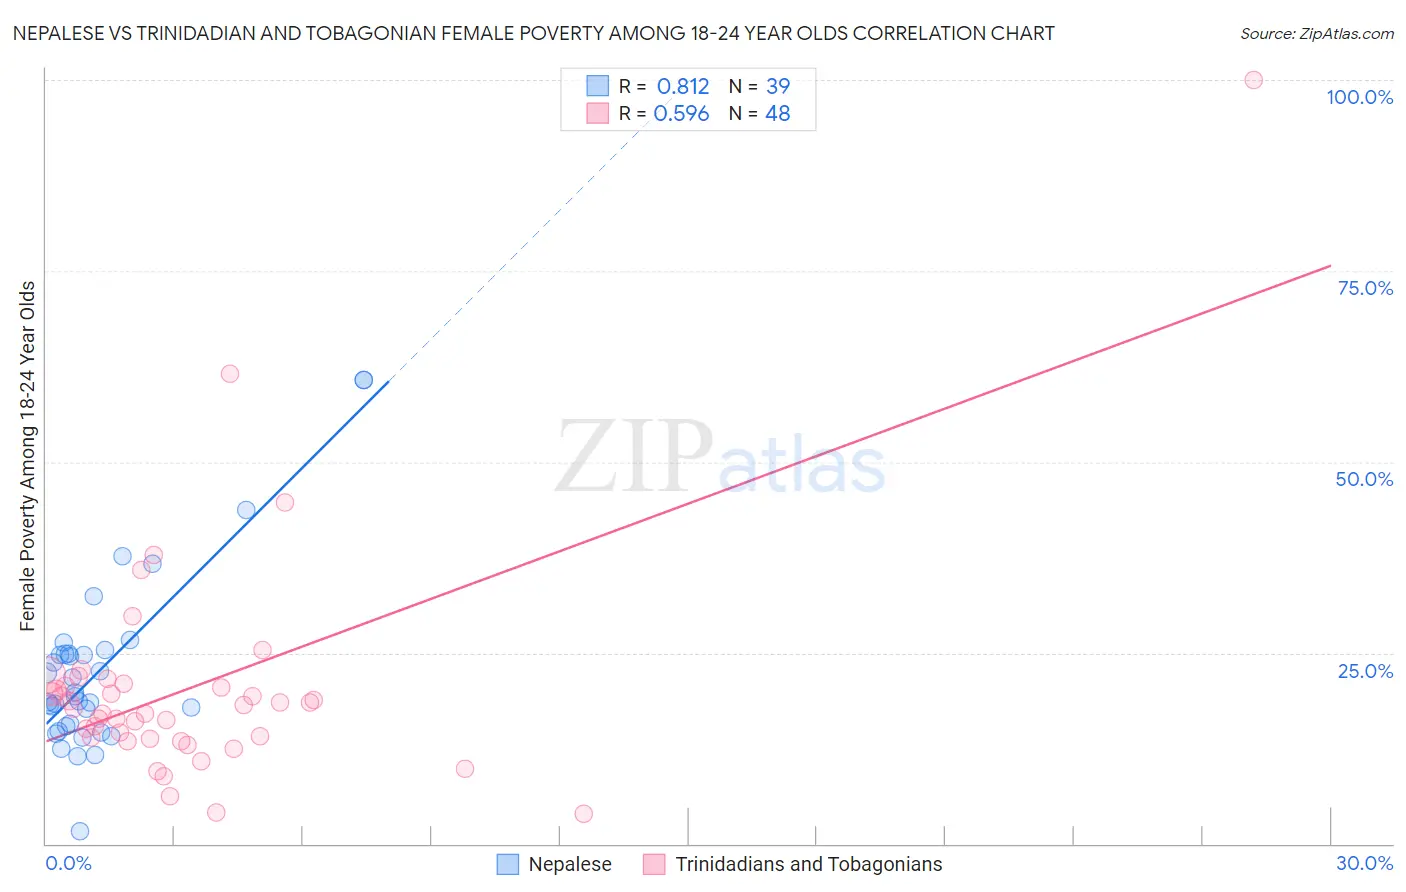
Nepalese vs Trinidadian and Tobagonian Female Poverty Among 18-24 Year Olds Correlation Chart
The statistical analysis conducted on geographies consisting of 24,489,423 people shows a very strong positive correlation between the proportion of Nepalese and poverty level among females between the ages 18 and 24 in the United States with a correlation coefficient (R) of 0.812 and weighted average of 20.2%. Similarly, the statistical analysis conducted on geographies consisting of 216,840,650 people shows a substantial positive correlation between the proportion of Trinidadians and Tobagonians and poverty level among females between the ages 18 and 24 in the United States with a correlation coefficient (R) of 0.596 and weighted average of 19.8%, a difference of 1.8%.
Female Poverty Among 18-24 Year Olds Correlation Summary
| Measurement | Nepalese | Trinidadian and Tobagonian |
| Minimum | 1.6% | 3.9% |
| Maximum | 60.7% | 100.0% |
| Range | 59.1% | 96.1% |
| Mean | 22.8% | 20.5% |
| Median | 19.4% | 17.9% |
| Interquartile 25% (IQ1) | 15.3% | 13.8% |
| Interquartile 75% (IQ3) | 24.9% | 20.7% |
| Interquartile Range (IQR) | 9.6% | 6.9% |
| Standard Deviation (Sample) | 11.9% | 15.3% |
| Standard Deviation (Population) | 11.7% | 15.2% |
Similar Demographics by Female Poverty Among 18-24 Year Olds
Demographics Similar to Nepalese by Female Poverty Among 18-24 Year Olds
In terms of female poverty among 18-24 year olds, the demographic groups most similar to Nepalese are Immigrants from Central America (20.2%, a difference of 0.010%), Lebanese (20.2%, a difference of 0.040%), Immigrants from Ethiopia (20.2%, a difference of 0.12%), Immigrants from China (20.2%, a difference of 0.16%), and Immigrants from Barbados (20.2%, a difference of 0.16%).
| Demographics | Rating | Rank | Female Poverty Among 18-24 Year Olds |
| Swiss | 44.0 /100 | #178 | Average 20.2% |
| Ethiopians | 43.8 /100 | #179 | Average 20.2% |
| Iraqis | 43.3 /100 | #180 | Average 20.2% |
| Immigrants | China | 43.0 /100 | #181 | Average 20.2% |
| Immigrants | Barbados | 42.8 /100 | #182 | Average 20.2% |
| Lebanese | 40.6 /100 | #183 | Average 20.2% |
| Immigrants | Central America | 39.9 /100 | #184 | Fair 20.2% |
| Nepalese | 39.7 /100 | #185 | Fair 20.2% |
| Immigrants | Ethiopia | 37.3 /100 | #186 | Fair 20.2% |
| Immigrants | Mexico | 36.3 /100 | #187 | Fair 20.2% |
| Scandinavians | 34.6 /100 | #188 | Fair 20.3% |
| Immigrants | Germany | 34.0 /100 | #189 | Fair 20.3% |
| Immigrants | Western Asia | 29.3 /100 | #190 | Fair 20.3% |
| Moroccans | 25.8 /100 | #191 | Fair 20.4% |
| Immigrants | Israel | 24.4 /100 | #192 | Fair 20.4% |
Demographics Similar to Trinidadians and Tobagonians by Female Poverty Among 18-24 Year Olds
In terms of female poverty among 18-24 year olds, the demographic groups most similar to Trinidadians and Tobagonians are Pakistani (19.8%, a difference of 0.020%), Immigrants from Belize (19.8%, a difference of 0.020%), Immigrants from Lebanon (19.8%, a difference of 0.060%), Danish (19.8%, a difference of 0.070%), and French Canadian (19.9%, a difference of 0.090%).
| Demographics | Rating | Rank | Female Poverty Among 18-24 Year Olds |
| Yugoslavians | 79.0 /100 | #152 | Good 19.8% |
| Immigrants | Japan | 78.1 /100 | #153 | Good 19.8% |
| Immigrants | Zimbabwe | 76.7 /100 | #154 | Good 19.8% |
| Hungarians | 76.6 /100 | #155 | Good 19.8% |
| Immigrants | Belgium | 76.4 /100 | #156 | Good 19.8% |
| Danes | 75.5 /100 | #157 | Good 19.8% |
| Immigrants | Lebanon | 75.3 /100 | #158 | Good 19.8% |
| Trinidadians and Tobagonians | 74.4 /100 | #159 | Good 19.8% |
| Pakistanis | 74.1 /100 | #160 | Good 19.8% |
| Immigrants | Belize | 74.1 /100 | #161 | Good 19.8% |
| French Canadians | 73.0 /100 | #162 | Good 19.9% |
| Malaysians | 72.7 /100 | #163 | Good 19.9% |
| Central Americans | 70.0 /100 | #164 | Good 19.9% |
| Eastern Europeans | 69.3 /100 | #165 | Good 19.9% |
| Belgians | 69.1 /100 | #166 | Good 19.9% |